

Question: B C D E F G H J K M The accompanying data shows the data on 70 former employees at one of the
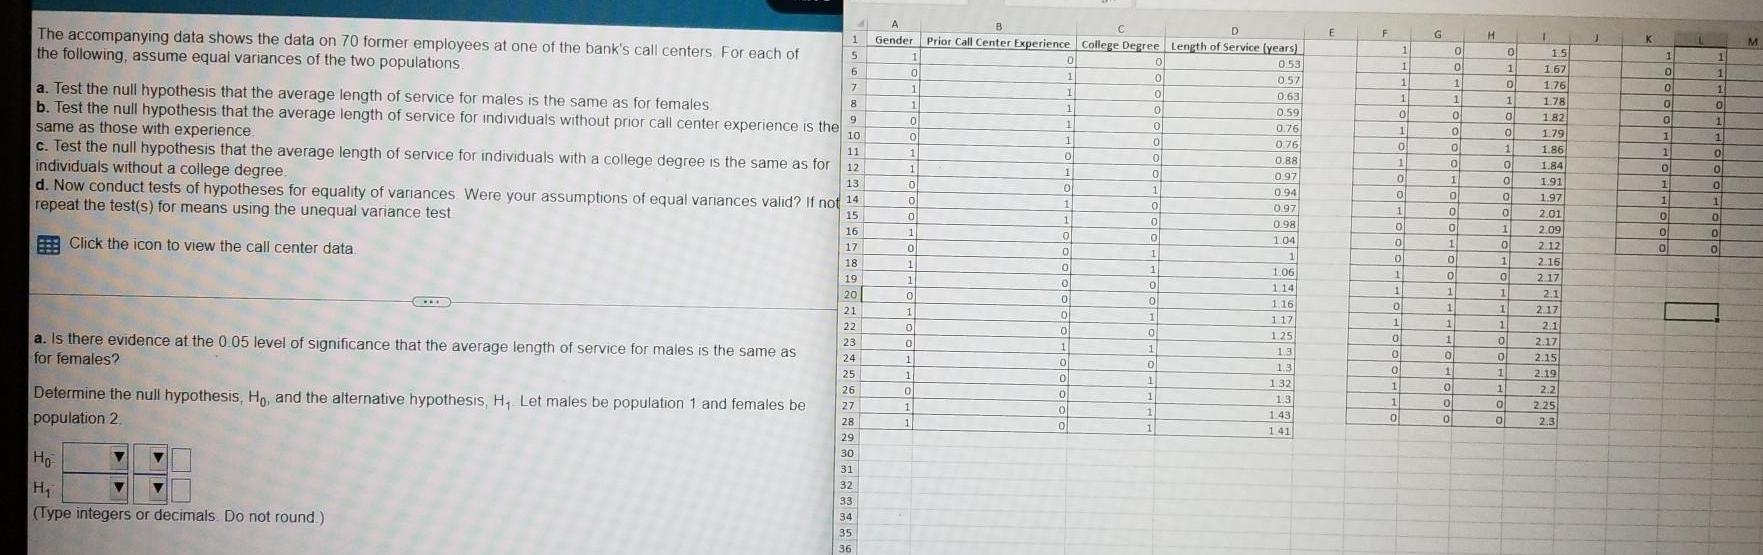
B C D E F G H J K M The accompanying data shows the data on 70 former employees at one of the bank's call centers. For each of the following, assume equal variances of the two populations. a. Test the null hypothesis that the average length of service for males is the same as for females. b. Test the null hypothesis that the average length of service for individuals without prior call center experience is the same as those with experience. c. Test the null hypothesis that the average length of service for individuals with a college degree is the same as for 12 individuals without a college degree. d. Now conduct tests of hypotheses for equality of variances Were your assumptions of equal variances valid? If not 14 repeat the test(s) for means using the unequal variance test Click the icon to view the call center data 1 Gender Prior Call Center Experience College Degree Length of Service (years) 1 0 0 1.5 1 1 5 1 D 0 0.53 1 0 1 1.67 0 1 6 0 1 0 0.57 1 1 0 1.76 0 1 7 1 1 0 0.63 1 1 1 1.78 0 8 1 0 0.59 0 0 1.82 0 1 9 0 1 0 0.76 1 0 1.79 1 1 10 O 1 0.76 0 0 1 1.86 1 0 11 1 0 0 0.88 1 0 0 1.84 0 0 1 0 0.97 0 1 0 1.91 1 0 13 0 0 1 0.94 0 0 0 1.97 1 1 0 1 0.97 1 0 0 2.01 0 O 15 0 1 0 0.98 0 1 2.09 0 0 16 1 0 0 1.04 0 1 0 2.12 0 17 0 0 1 1 0 2.16 18 1 1.06 1 0 2.17 19 1 0 1.14 1 1 2.1 20 0 0 0 1.16 0 1 1 2.17 21 1 1.17 1 1 1 2.1 22 0 0 1.25 0 0 2.17 a. Is there evidence at the 0.05 level of significance that the average length of service for males is the same as for females? 23 1 1 13 0 0 2.15 24 1 0 H Determine the null hypothesis, Ho, and the alternative hypothesis, H, Let males be population 1 and females be population 2 Ho 0 1.3 1 1 2.19 25 D 1 1.32 1 0 1 2.2 26 0 1 1.3 1 0 0 2.25 27 1 1 1.43 0 0 2.3 28 1 0 1 141 29 30 31 32 33 (Type integers or decimals. Do not round) 34 35 36
Step by Step Solution
There are 3 Steps involved in it

Get step-by-step solutions from verified subject matter experts