

Question: B c D G O H M N Use rate-of-return data over 60-month period for Alphabet, the T-bitrate, and the S&P 500 which wilbe used
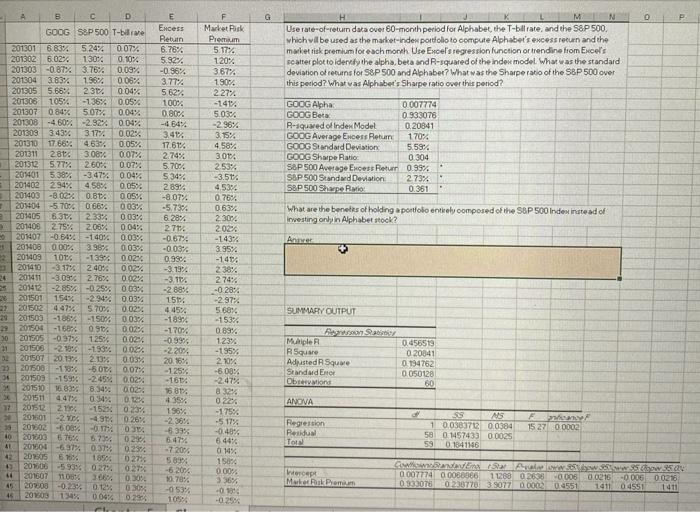
B c D G O H M N Use rate-of-return data over 60-month period for Alphabet, the T-bitrate, and the S&P 500 which wilbe used as the market-index portfolio to compute Alphabet's excess return and the market tisk premium for each month Ure Excel's regression function or trendine from Excel's scatter plotto identify the alpha, beta and R-squared of the Indow model. What was the standard deviation of returns for S&P 500 and Alphabet? What was the Sharpe ratio of the S&P 500 over this period? What was Alphabet's Sharpe ratio over this period? GOOGAlpha 0.007774 GOOGB 0.933078 R-quwed of Index Model 0.20841 GOOG Average Encess Returns 170% GOOG Standard Deviations 5.58% GOOG Shape Ratio 0.304 S&P 500 Average Excess Return 0.99% S&P 500 Standud Deviation 2.73% S&P 500 Shape R 0.361 GOOG S&P 500 T-bare 201301 6.83% 5.24% 0.07% 201302 6.02% 1304 0.10% 201303 -0.87% 3.76%. 0.03%. 201304 3.83% 1.58% 0.06% 201305 5.66% 231 0.04% 201306 105% -136% 0.05% 201307 0.84% 5.07% 0.04% 201308 -4.60% -2.32% 0.04% 201303 3.43% 317%. 0.02% 201310 17.66% 463% 0.05% 201311 28. 3.08% 0.07% 201312 5.27% 260% 0.07%. 201401 5.38% -347% 0.04%. 201402 294%. 4.58% 0.05% 201403 -802% 0.80. 0055 201404 -5.700 0.66% 003% 201405 6.31% 233% 0.03 201409 2.75% 206% 0.04% 201407 -0.54%. -140% 0.03% 201408 0.00% 3.38% 0034 201409 101 -13394 0.02% 201410 -3.17% 2.405. 0.02% 24 201411 -3.09 2.76% 0.02% 201412 -2.85 -0.25% 0.03% 201501 15454 -2.94 0.03% 1 201503 4.97% 5.70 0.025 20 201503 -188% -1500 003% 201504 -16% 0.90 0024 2015.05 -0.97 125% 0.02% 21 201505 -2186-193% 0.02% 201507 20.1344 2.13 0.03% 201500 -18% -5014 0.07% 34 201509 -1595 0.02% 24 201510 8.349. 003, 201511 4.41% 0.34%, 0.1 201512 21% -15% 02% 20 201501 -20% -49% 0 26% > 2010 -60% - 40 201000 6 70% 6.73 2004 -67% 0.37% 0.23% 42 2005 6.75% 1850 027 20600 -59356 027% 0273 64 201601 1100 0.305 49 20900 -0.23% 0.12% 0 30% 45 20103 4% 0.04% Encess Rebuin 6.76% 5.92% -0.86% 3.774 5.62% 100% 0.80% -4 64% 3.41% 17.614 274% 57004 5 34% 2897 -8.07% -5734 6.284 271 -0.67 -0.03% 0.95% -3.19% -3.106 -2889 151 4.4534 -1890 -170 -0.99 -2.20% 20.16% -125% -1614 16 01 35% What are the benets of holding a portfolio entirely composed of the S&P 500 Indes instead of Investing only in Alphabet ook? Market Risk Premium 5.174 120% 3.674 1905 2 27% -141 5.0304 -2 96% 3.15% 4.58% 3014 253% -3.51 4.53% 0.76%. 0.63% 230% 202% -143% 3.95% -1414 2 38% 274 -0.28% -2.97% 5.68% -153% 089% 123 -1958 2.70% -608% -2.47% a 32% 0.22% -175% -5 17% -048 6 44% 0 14% 150% 0.00% 36% -0% SUMMARY OUTPUT 29 Multiple Square Adusted Squwe Standard Ener Obration 0.456519 0.20341 194752 0050128 60 ANOVA F 15 27 00002 0306 0230 NS 1 0.038372 0.0384 58 01457433 00025 01041146 Regression Residual TO -720% 5899 -6 2014 10.70% -053 105% Intercept Merk Premium www.Awwa 0.007774 00060066 11288 02630006 00216-0006 00216 0230770 3.9077 0.00008551 141104551 1411 B c D G O H M N Use rate-of-return data over 60-month period for Alphabet, the T-bitrate, and the S&P 500 which wilbe used as the market-index portfolio to compute Alphabet's excess return and the market tisk premium for each month Ure Excel's regression function or trendine from Excel's scatter plotto identify the alpha, beta and R-squared of the Indow model. What was the standard deviation of returns for S&P 500 and Alphabet? What was the Sharpe ratio of the S&P 500 over this period? What was Alphabet's Sharpe ratio over this period? GOOGAlpha 0.007774 GOOGB 0.933078 R-quwed of Index Model 0.20841 GOOG Average Encess Returns 170% GOOG Standard Deviations 5.58% GOOG Shape Ratio 0.304 S&P 500 Average Excess Return 0.99% S&P 500 Standud Deviation 2.73% S&P 500 Shape R 0.361 GOOG S&P 500 T-bare 201301 6.83% 5.24% 0.07% 201302 6.02% 1304 0.10% 201303 -0.87% 3.76%. 0.03%. 201304 3.83% 1.58% 0.06% 201305 5.66% 231 0.04% 201306 105% -136% 0.05% 201307 0.84% 5.07% 0.04% 201308 -4.60% -2.32% 0.04% 201303 3.43% 317%. 0.02% 201310 17.66% 463% 0.05% 201311 28. 3.08% 0.07% 201312 5.27% 260% 0.07%. 201401 5.38% -347% 0.04%. 201402 294%. 4.58% 0.05% 201403 -802% 0.80. 0055 201404 -5.700 0.66% 003% 201405 6.31% 233% 0.03 201409 2.75% 206% 0.04% 201407 -0.54%. -140% 0.03% 201408 0.00% 3.38% 0034 201409 101 -13394 0.02% 201410 -3.17% 2.405. 0.02% 24 201411 -3.09 2.76% 0.02% 201412 -2.85 -0.25% 0.03% 201501 15454 -2.94 0.03% 1 201503 4.97% 5.70 0.025 20 201503 -188% -1500 003% 201504 -16% 0.90 0024 2015.05 -0.97 125% 0.02% 21 201505 -2186-193% 0.02% 201507 20.1344 2.13 0.03% 201500 -18% -5014 0.07% 34 201509 -1595 0.02% 24 201510 8.349. 003, 201511 4.41% 0.34%, 0.1 201512 21% -15% 02% 20 201501 -20% -49% 0 26% > 2010 -60% - 40 201000 6 70% 6.73 2004 -67% 0.37% 0.23% 42 2005 6.75% 1850 027 20600 -59356 027% 0273 64 201601 1100 0.305 49 20900 -0.23% 0.12% 0 30% 45 20103 4% 0.04% Encess Rebuin 6.76% 5.92% -0.86% 3.774 5.62% 100% 0.80% -4 64% 3.41% 17.614 274% 57004 5 34% 2897 -8.07% -5734 6.284 271 -0.67 -0.03% 0.95% -3.19% -3.106 -2889 151 4.4534 -1890 -170 -0.99 -2.20% 20.16% -125% -1614 16 01 35% What are the benets of holding a portfolio entirely composed of the S&P 500 Indes instead of Investing only in Alphabet ook? Market Risk Premium 5.174 120% 3.674 1905 2 27% -141 5.0304 -2 96% 3.15% 4.58% 3014 253% -3.51 4.53% 0.76%. 0.63% 230% 202% -143% 3.95% -1414 2 38% 274 -0.28% -2.97% 5.68% -153% 089% 123 -1958 2.70% -608% -2.47% a 32% 0.22% -175% -5 17% -048 6 44% 0 14% 150% 0.00% 36% -0% SUMMARY OUTPUT 29 Multiple Square Adusted Squwe Standard Ener Obration 0.456519 0.20341 194752 0050128 60 ANOVA F 15 27 00002 0306 0230 NS 1 0.038372 0.0384 58 01457433 00025 01041146 Regression Residual TO -720% 5899 -6 2014 10.70% -053 105% Intercept Merk Premium www.Awwa 0.007774 00060066 11288 02630006 00216-0006 00216 0230770 3.9077 0.00008551 141104551 1411
Step by Step Solution
There are 3 Steps involved in it

Get step-by-step solutions from verified subject matter experts