

Question: B C G 94 b. Now conduct a sensitivity analysis to determine the sensitivity of NPV to changes in the sales price, 195 variable costs
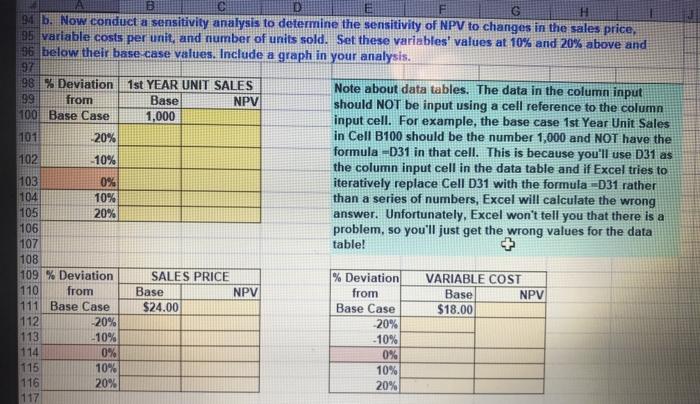
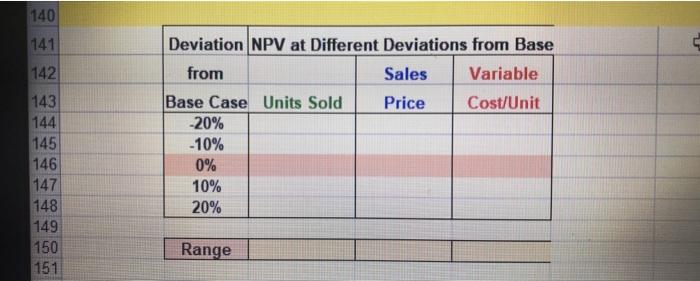
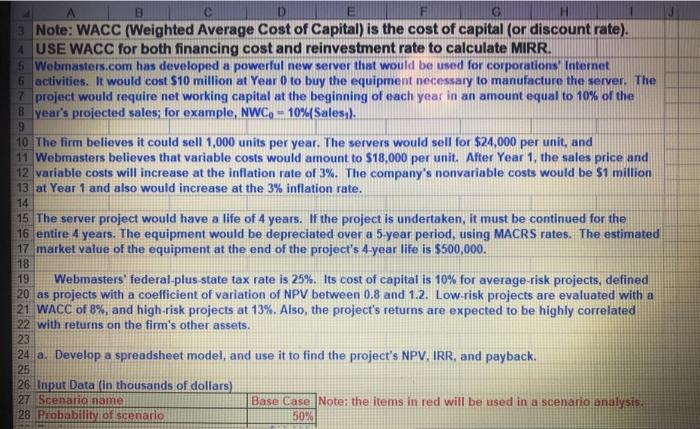
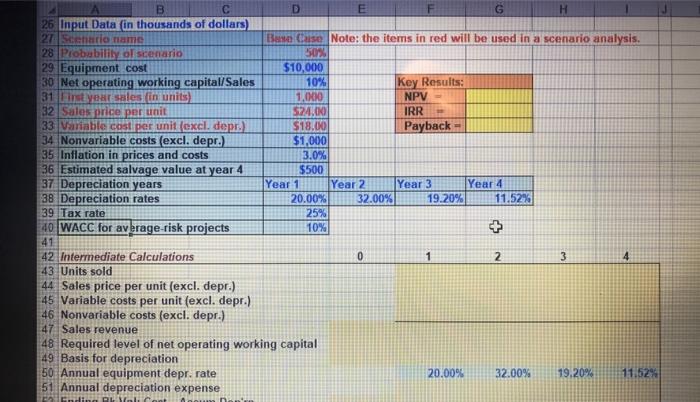
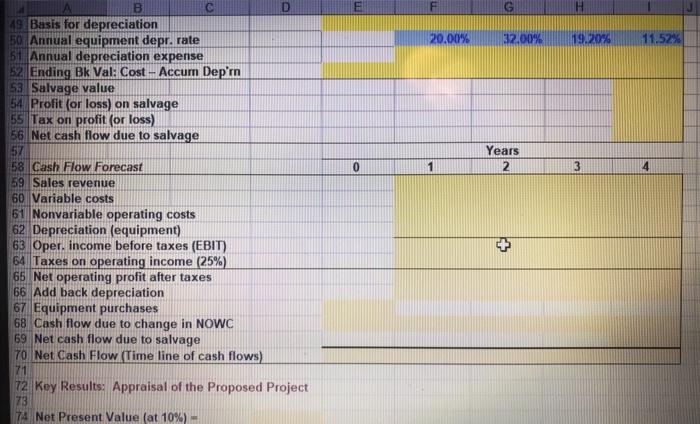
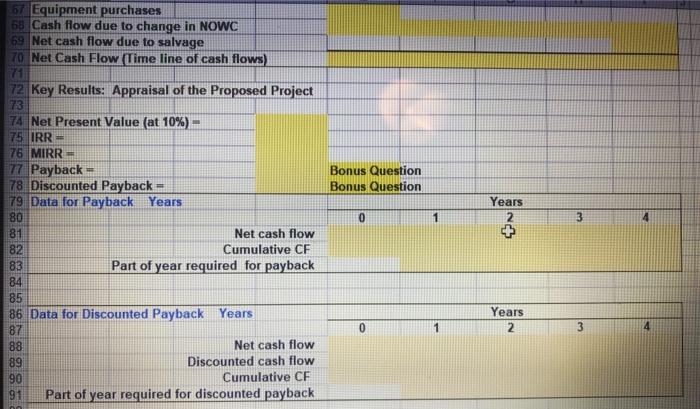
B C G 94 b. Now conduct a sensitivity analysis to determine the sensitivity of NPV to changes in the sales price, 195 variable costs per unit, and number of units sold. Set these variables' values at 10% and 20% above and 196 below their base case values. Include a graph in your analysis. 197 98 % Deviation 1st YEAR UNIT SALES Note about data tables. The data in the column input 199 from Base NPV should NOT be input using a cell reference to the column 100 Base Case 1,000 input cell. For example, the base case 1st Year Unit Sales 101 20% in Cell B100 should be the number 1,000 and NOT have the formula -D31 in that cell. This is because you'll use D31 as 102 10% the column input cell in the data table and if Excel tries to 103 0% iteratively replace Cell D31 with the formula =D31 rather 104 10% than a series of numbers, Excel will calculate the wrong 105 20% answer. Unfortunately, Excel won't tell you that there is a 106 problem, so you'll just get the wrong values for the data 107 table! 108 109 % Deviation SALES PRICE % Deviation VARIABLE COST 110 from Base NPV from Base NPV 111 Base Case $24.00 Base Case $18.00 112 -20% 20% 113 -10% -10% 114 0% 0% 115 10% 10% 116 20% 20% 117 140 141 142 143 (144 145 146 147 148 149 150 151 Deviation NPV at Different Deviations from Base from Sales Variable Base Case Units Sold Price Cost/Unit -20% -10% 0% 10% 20% Range D G 3 Note: WACC (Weighted Average Cost of Capital) is the cost of capital (or discount rate). 4 USE WACC for both financing cost and reinvestment rate to calculate MIRR. $ Webmasters.com has developed a powerful new server that would be used for corporations Internet 6 activities. It would cost $10 million at Year 0 to buy the equipment necessary to manufacture the server. The 7 project would require net working capital at the beginning of each year in an amount equal to 10% of the Byear's projected sales; for example, NWC. -10% Salesil. 9 10 The firm believes it could sell 1,000 units per year. The servers would sell for $24,000 per unit, and 11 Webmasters believes that variable costs would amount to $18,000 per unit. After Year 1, the sales price and 12 variable costs will increase at the inflation rate of 3%. The company's nonvariable costs would be $1 million 13 at Year 1 and also would increase at the 3% inflation rate. 14 15 The server project would have a life of 4 years. If the project is undertaken, it must be continued for the 16 entire 4 years. The equipment would be depreciated over a 5 year period, using MACRS rates. The estimated 17 market value of the equipment at the end of the project's 4-year life is $500,000. 18 19 Webmasters' federal-plus-state tax rate is 25%. Its cost of capital is 10% for average risk projects, defined 20 as projects with a coefficient of variation of NPV between 0.8 and 1.2. Low-risk projects are evaluated with a 21 WACC of 8%, and high-risk projects at 13%. Also, the project's returns are expected to be highly correlated 22 with returns on the firm's other assets. 23 24 a. Develop a spreadsheet model, and use it to find the project's NPV, IRR. and payback. 25 26 Input Datalin thousands of dollars) 27 Scenario name Base Case Note: the items in red will be used in a scenario analysis, 28. Probability of scenario 50% B D E G H 26 Input Data (in thousands of dollars 27 Scientia name Base Case Note: the items in red will be used in a scenario analysis. 28 Probability of scenario 50% 29 Equipment cost $10,000 30. Net operating working capital/Sales 10% Key Results: 31 instversales in units) 1,000 NPV 32 Sales price per unit 524.00 IRR 33 Variable cost per unit (excl. depr.) $18.00 Payback 34 Nonvariable costs (excl. depr.) $1,000 35 Inflation in prices and costs 3.0% 36 Estimated salvage value at year 4 $500 37 Depreciation years Year 1 Year 2 Year 3 Year 4 38 Depreciation rates 20.00% 32.00% 19.20% 11.52% 39 Tax rate 25% 40 WACC for average-risk projects 10% 41 42 Intermediate Calculations 0 1 2 3 4 43 Units sold 44 Sales price per unit (excl. depr.) 45 Variable costs per unit (excl. depr.) 46 Nonvariable costs (excl. depr.) 47 Sales revenue 48 Required level of net operating working capital 49 Basis for depreciation 50 Annual equipment depr. rate 20.00% 32.00% 19.20% 11.52% 51 Annual depreciation expense di PL F 20.00% 32.00% 19.20% 11.52% Years 2 0 1 3 4 B 49 Basis for depreciation 50 Annual equipment depr. rate 51 Annual depreciation expense 52 Ending Bk Val: Cost - Accum Dep'rn 53 Salvage value 54 Profit (or loss) on salvage 55 Tax on profit (or loss) 56 Net cash flow due to salvage 57 58 Cash Flow Forecast 59 Sales revenue 60 Variable costs 61 Nonvariable operating costs 62 Depreciation (equipment) 63 Oper. income before taxes (EBIT) 64 Taxes on operating income (25%) 65 Net operating profit after taxes 66 Add back depreciation 67 Equipment purchases 68 Cash flow due to change in NOWC 69 Net cash flow due to salvage 70 Net Cash Flow Time line of cash flows) 71 72 Key Results: Appraisal of the Proposed Project 73 TA Net Present Value (at 10%) Bonus Question Bonus Question 67 Equipment purchases 68 Cash flow due to change in NOWC 69 Net cash flow due to salvage 70 Net Cash Flow Time line of cash flows) 71 72 Key Results: Appraisal of the Proposed Project 73 74 Net Present Value (at 10%) - 75 IRR- 76 MIRR = 77 Payback 78 Discounted Payback - 79 Data for Payback Years 80 81 Net cash flow 82 Cumulative CF 83 Part of year required for payback 84 85 86 Data for Discounted Payback Years 87 88 Net cash flow 89 Discounted cash flow 90 Cumulative CF 91 Part of year required for discounted payback Years 0 1 3 +N Years 2 0 1 3 B C G 94 b. Now conduct a sensitivity analysis to determine the sensitivity of NPV to changes in the sales price, 195 variable costs per unit, and number of units sold. Set these variables' values at 10% and 20% above and 196 below their base case values. Include a graph in your analysis. 197 98 % Deviation 1st YEAR UNIT SALES Note about data tables. The data in the column input 199 from Base NPV should NOT be input using a cell reference to the column 100 Base Case 1,000 input cell. For example, the base case 1st Year Unit Sales 101 20% in Cell B100 should be the number 1,000 and NOT have the formula -D31 in that cell. This is because you'll use D31 as 102 10% the column input cell in the data table and if Excel tries to 103 0% iteratively replace Cell D31 with the formula =D31 rather 104 10% than a series of numbers, Excel will calculate the wrong 105 20% answer. Unfortunately, Excel won't tell you that there is a 106 problem, so you'll just get the wrong values for the data 107 table! 108 109 % Deviation SALES PRICE % Deviation VARIABLE COST 110 from Base NPV from Base NPV 111 Base Case $24.00 Base Case $18.00 112 -20% 20% 113 -10% -10% 114 0% 0% 115 10% 10% 116 20% 20% 117 140 141 142 143 (144 145 146 147 148 149 150 151 Deviation NPV at Different Deviations from Base from Sales Variable Base Case Units Sold Price Cost/Unit -20% -10% 0% 10% 20% Range D G 3 Note: WACC (Weighted Average Cost of Capital) is the cost of capital (or discount rate). 4 USE WACC for both financing cost and reinvestment rate to calculate MIRR. $ Webmasters.com has developed a powerful new server that would be used for corporations Internet 6 activities. It would cost $10 million at Year 0 to buy the equipment necessary to manufacture the server. The 7 project would require net working capital at the beginning of each year in an amount equal to 10% of the Byear's projected sales; for example, NWC. -10% Salesil. 9 10 The firm believes it could sell 1,000 units per year. The servers would sell for $24,000 per unit, and 11 Webmasters believes that variable costs would amount to $18,000 per unit. After Year 1, the sales price and 12 variable costs will increase at the inflation rate of 3%. The company's nonvariable costs would be $1 million 13 at Year 1 and also would increase at the 3% inflation rate. 14 15 The server project would have a life of 4 years. If the project is undertaken, it must be continued for the 16 entire 4 years. The equipment would be depreciated over a 5 year period, using MACRS rates. The estimated 17 market value of the equipment at the end of the project's 4-year life is $500,000. 18 19 Webmasters' federal-plus-state tax rate is 25%. Its cost of capital is 10% for average risk projects, defined 20 as projects with a coefficient of variation of NPV between 0.8 and 1.2. Low-risk projects are evaluated with a 21 WACC of 8%, and high-risk projects at 13%. Also, the project's returns are expected to be highly correlated 22 with returns on the firm's other assets. 23 24 a. Develop a spreadsheet model, and use it to find the project's NPV, IRR. and payback. 25 26 Input Datalin thousands of dollars) 27 Scenario name Base Case Note: the items in red will be used in a scenario analysis, 28. Probability of scenario 50% B D E G H 26 Input Data (in thousands of dollars 27 Scientia name Base Case Note: the items in red will be used in a scenario analysis. 28 Probability of scenario 50% 29 Equipment cost $10,000 30. Net operating working capital/Sales 10% Key Results: 31 instversales in units) 1,000 NPV 32 Sales price per unit 524.00 IRR 33 Variable cost per unit (excl. depr.) $18.00 Payback 34 Nonvariable costs (excl. depr.) $1,000 35 Inflation in prices and costs 3.0% 36 Estimated salvage value at year 4 $500 37 Depreciation years Year 1 Year 2 Year 3 Year 4 38 Depreciation rates 20.00% 32.00% 19.20% 11.52% 39 Tax rate 25% 40 WACC for average-risk projects 10% 41 42 Intermediate Calculations 0 1 2 3 4 43 Units sold 44 Sales price per unit (excl. depr.) 45 Variable costs per unit (excl. depr.) 46 Nonvariable costs (excl. depr.) 47 Sales revenue 48 Required level of net operating working capital 49 Basis for depreciation 50 Annual equipment depr. rate 20.00% 32.00% 19.20% 11.52% 51 Annual depreciation expense di PL F 20.00% 32.00% 19.20% 11.52% Years 2 0 1 3 4 B 49 Basis for depreciation 50 Annual equipment depr. rate 51 Annual depreciation expense 52 Ending Bk Val: Cost - Accum Dep'rn 53 Salvage value 54 Profit (or loss) on salvage 55 Tax on profit (or loss) 56 Net cash flow due to salvage 57 58 Cash Flow Forecast 59 Sales revenue 60 Variable costs 61 Nonvariable operating costs 62 Depreciation (equipment) 63 Oper. income before taxes (EBIT) 64 Taxes on operating income (25%) 65 Net operating profit after taxes 66 Add back depreciation 67 Equipment purchases 68 Cash flow due to change in NOWC 69 Net cash flow due to salvage 70 Net Cash Flow Time line of cash flows) 71 72 Key Results: Appraisal of the Proposed Project 73 TA Net Present Value (at 10%) Bonus Question Bonus Question 67 Equipment purchases 68 Cash flow due to change in NOWC 69 Net cash flow due to salvage 70 Net Cash Flow Time line of cash flows) 71 72 Key Results: Appraisal of the Proposed Project 73 74 Net Present Value (at 10%) - 75 IRR- 76 MIRR = 77 Payback 78 Discounted Payback - 79 Data for Payback Years 80 81 Net cash flow 82 Cumulative CF 83 Part of year required for payback 84 85 86 Data for Discounted Payback Years 87 88 Net cash flow 89 Discounted cash flow 90 Cumulative CF 91 Part of year required for discounted payback Years 0 1 3 +N Years 2 0 1 3
Step by Step Solution
There are 3 Steps involved in it

Get step-by-step solutions from verified subject matter experts