

Question: b. Calculate the 2018 current and quick ratios based on the projected balance sheet and income statement data. What can you say about the companys
b. Calculate the 2018 current and quick ratios based on the projected balance sheet and income statement data. What can you say about the companys liquidity position in 2016, 2017, and as projected for 2018? We often think of ratios as being useful: (1) to managers to help run the business, (2) to bankers for credit analysis, and (3) to stockholders for stock valuation. Would these different types of analysts have an equal interest in the liquidity ratios? c. Calculate the 2018 inventory turnover, days sales outstanding (DSO), fixed assets turnover, and total assets turnover. How does Computrons utilization of assets stack up against that of other firms in its industry? d. Calculate the 2018 debt ratio, liabilities-to-assets ratio, times-interest-earned ratio, and EBITDA coverage ratios. How does Computron compare with the industry with respect to financial leverage? What can you conclude from these ratios? e. Calculate the 2018 profit margin, basic earning power (BEP), return on assets (ROA), and return on equity (ROE). What can you say about these ratios? f. Calculate the 2018 price/earnings ratio, price/cash flow ratio, and market/book ratio. Do these ratios indicate that investors are expected to have a high or low opinion of the company? g. Perform a common size analysis and percentage change analysis. What do these analyses tell you about Computron? (For part g, use the 2 most recent years.) h. Use the extended DuPont equation to provide a summary and overview of Computrons financial condition as projected for 2018. What are the firms major strengths and weaknesses? i. What are some potential problems and limitations of financial ratio analysis? j. What are some qualitative factors that analysts should consider when evaluating a companys likely future financial performance?
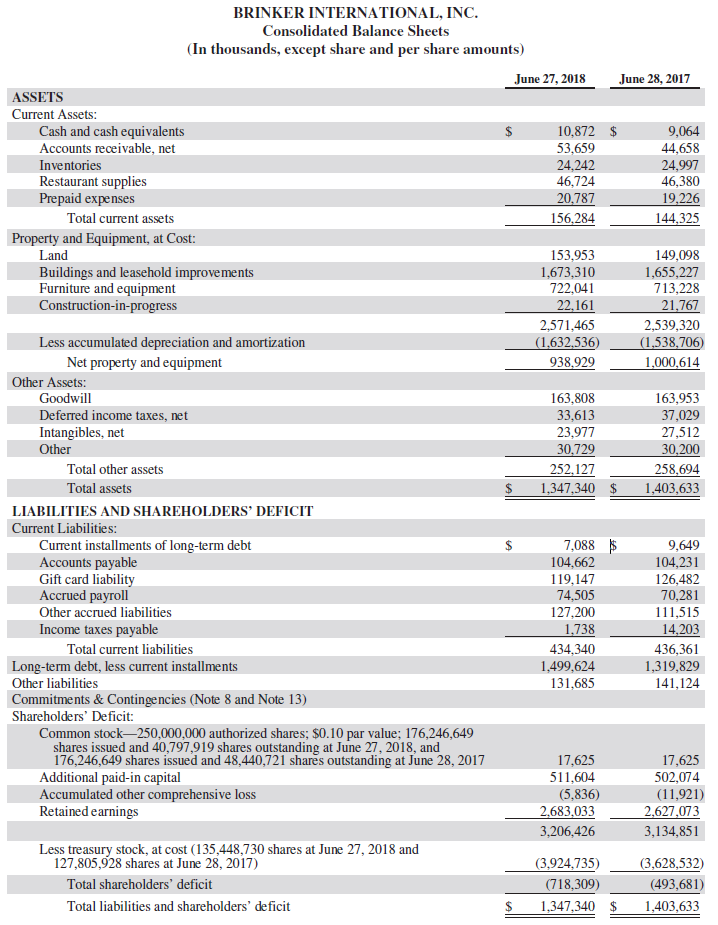
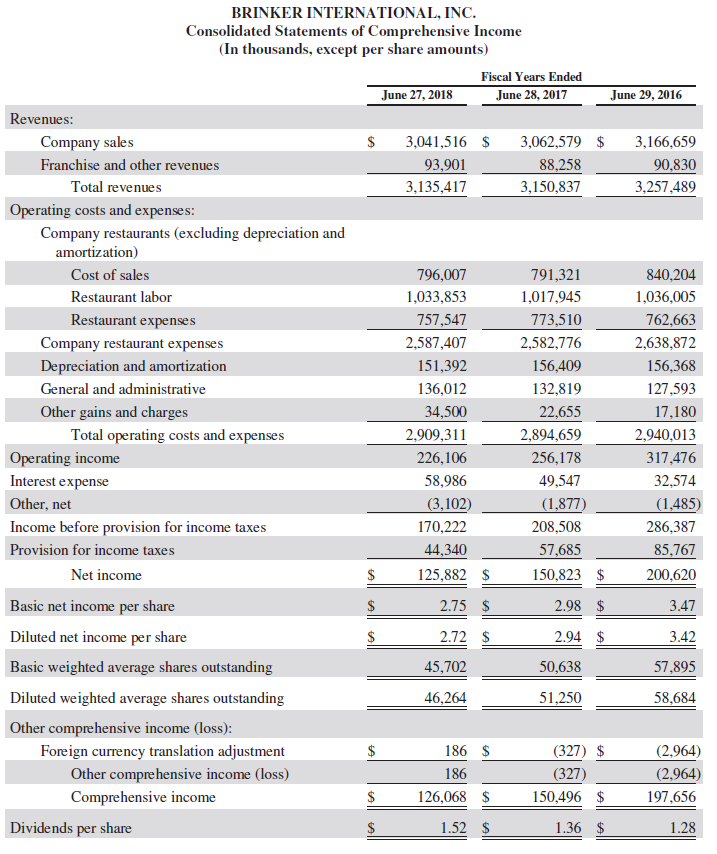
BRINKER INTERNATIONAL, INC Consolidated Balance Sheets (In thousands, except share and per share amounts) June 27, 2018 June 28, 2017 ASSETS Current Assets Cash and cash equivalents Accounts receivable, net 10,872 $ 53,659 44,658 24,997 46,380 Inventories 24,242 46,724 20,787 Restaurant supplies Prepaid expenses 156 Total current assets 144,325 Property and Equipment, at Cost: Land 153,953 149,098 1,673,310 722,041 Buildings and leasehold improvements Furniture and equipment Construction-in-progress 1,655,227 713,228 2,539,320 2,571,465 Less accumulated depreciation and amortization Net property and equipment 938,929 1,000,614 Goodwill 163,808 163,953 37,029 Deferred income taxes, net Intangibles, net Other 33,613 23.977 30,729 30,200 Total other assets 258,694 Total assets S 1.347.340 $ 1.403.633 LIABILITIES AND SHAREHOLDERS' DEFICIT Current Liabilities: 7,088 Current installments of long-term debt Accounts payable Gift card liability Accrued 104,662 104,231 126,482 70,281 119,147 74,505 127,200 payroll Other accrued liabilities 111,515 1.738 14,203 Income taxes payable Total current liabilities 434,340 1,319,829 Long-term debt, less current installments Other liabilities 1,499,624 131,685 141,124 Commitments& Continge ncies (Note 8 and Note 13) Shareholders' Deficit: Common stock-250,000,000 authorized shares; $0.10 par value; 176,246,649 shares issued and 40,797,919 shares outstanding at June 27, 2018, and 176,246,649 shares issued and 48,440,721 shares outstanding at June 28, 2017 Additional paid-in capital Accumulated other comprehensive lo Retained earnings 17,625 502,074 (11,921) 17,625 511,604 (5,836) 2,683,033 2,627,07 3,134,851 3,206,426 Less treasury stock, at cost (135,448,730 shares at June 27, 2018 and 127,805.,928 shares at June 28, 2017) (3,924.735) (3,628,532) 718.309) Total shareholders' deficit (493,681) Total liabilities and shareholders' deficit $ 1,347,340 1,403,633 BRINKER INTERNATIONAL, INC Consolidated Statements of Comprehensive Income (In thousands, except per share amounts) Fiscal Years Ended June 27, 2018 June 28, 2017 June 29, 2016 Revenues: Company sales $ 3,041,516 $ 3,062,579 $ 3,166,659 Franchise and other revenues 93,90188,25890,830 3,135,417 Total revenues 3,150,837 3,257,489 Operating costs and expen ses: Company restaurants (excluding depreciation and amortization) 791,321 Cost of sales 796,007 840,204 1,036,005 Restaurant labor 1,033,853 1,017,945 773,510 Restaurant expenses 757,547 762,663 2,638,872 2,582,776 Company restaurant expenses 2,587,407 Depreciation and amortization 151,392 156,409 156,368 General and administrative 136,012 132,819 127,593 r gains and charges 34,500 22,655 2,909,311 Total operating costs and expenses 2,894,659 2,940,013 Operating income 226,106 256,178 317,476 58,986 Interest expense 32,574 (1,485) Other, net Income before provision for income taxes 170,222 208,508 286,387 Provision for income taxes 57,685 85,767 125,882 $ 150,823 $ 200,620 Net income 3.47 2.75 $ Basic net income per share Diluted net income per Basic weighted average shares outst anding 45,702 50,638 57,895 46,264 Diluted weighted average shares outstanding 51,250 58,684 Other comprehensive income (loss) (2,964) reign currency translation adjustment (327) $ Other comprehensive income (loss) (327) 2,964) 126,068 $ 150,496 $ Comprehensive income 197,656 Dividends per share
Step by Step Solution
There are 3 Steps involved in it

Get step-by-step solutions from verified subject matter experts