

Question: b. Compute the MSE for each set of forecasts. Given your results, which forecast oppears to be more accurate? (Round your answers to 2 decimal
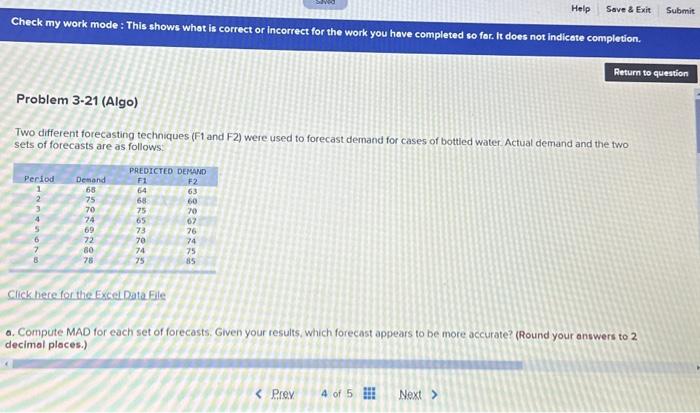
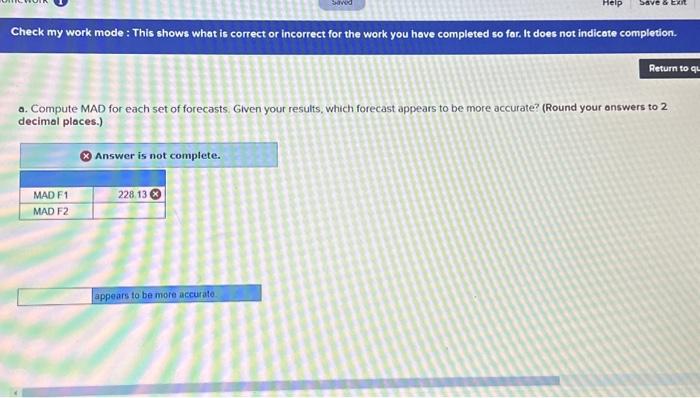
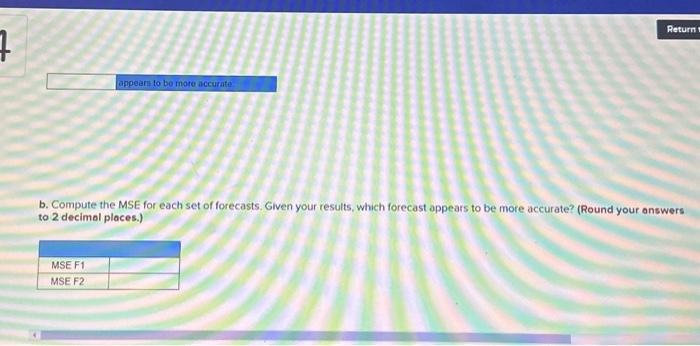
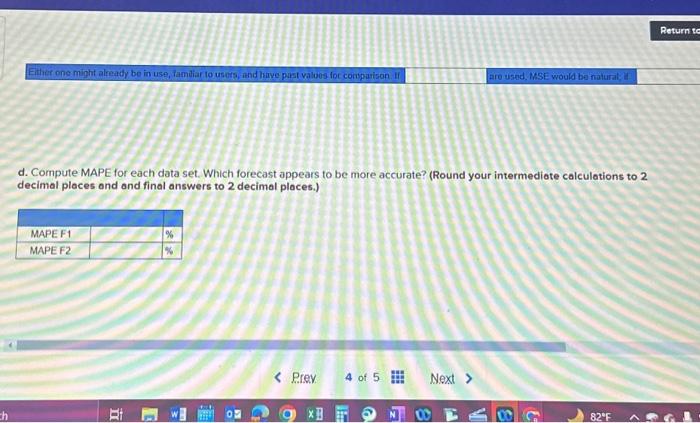
b. Compute the MSE for each set of forecasts. Given your results, which forecast oppears to be more accurate? (Round your answers to 2 decimal places.) d. Compute MAPE for each data set. Which forecast appears to be more accurate? (Round your intermediate calculations to 2 decimal places and and final answers to 2 decimal places.) Two different forecasting techniques (F1 and F2 ) were used to forecast demand for cases of bottled water. Actual demand and the two sets of forecasts are as follows: Click here for the Excel Data File a. Compute MAD for each set of forecasts. Given your results, which forecast appears to be more accurate? (Round your answers to 2 decimal ploces.) a. Compute MAD for each set of forecasts. Given yout results, which forecast appears to be more accurate? (Round your onswers to 2 decimal places.) Answer is not complete
Step by Step Solution
There are 3 Steps involved in it

Get step-by-step solutions from verified subject matter experts