

Question: B. Consider the graph below. There are three data points (A, B and C) and two lines (D and E). Line D is the OLS
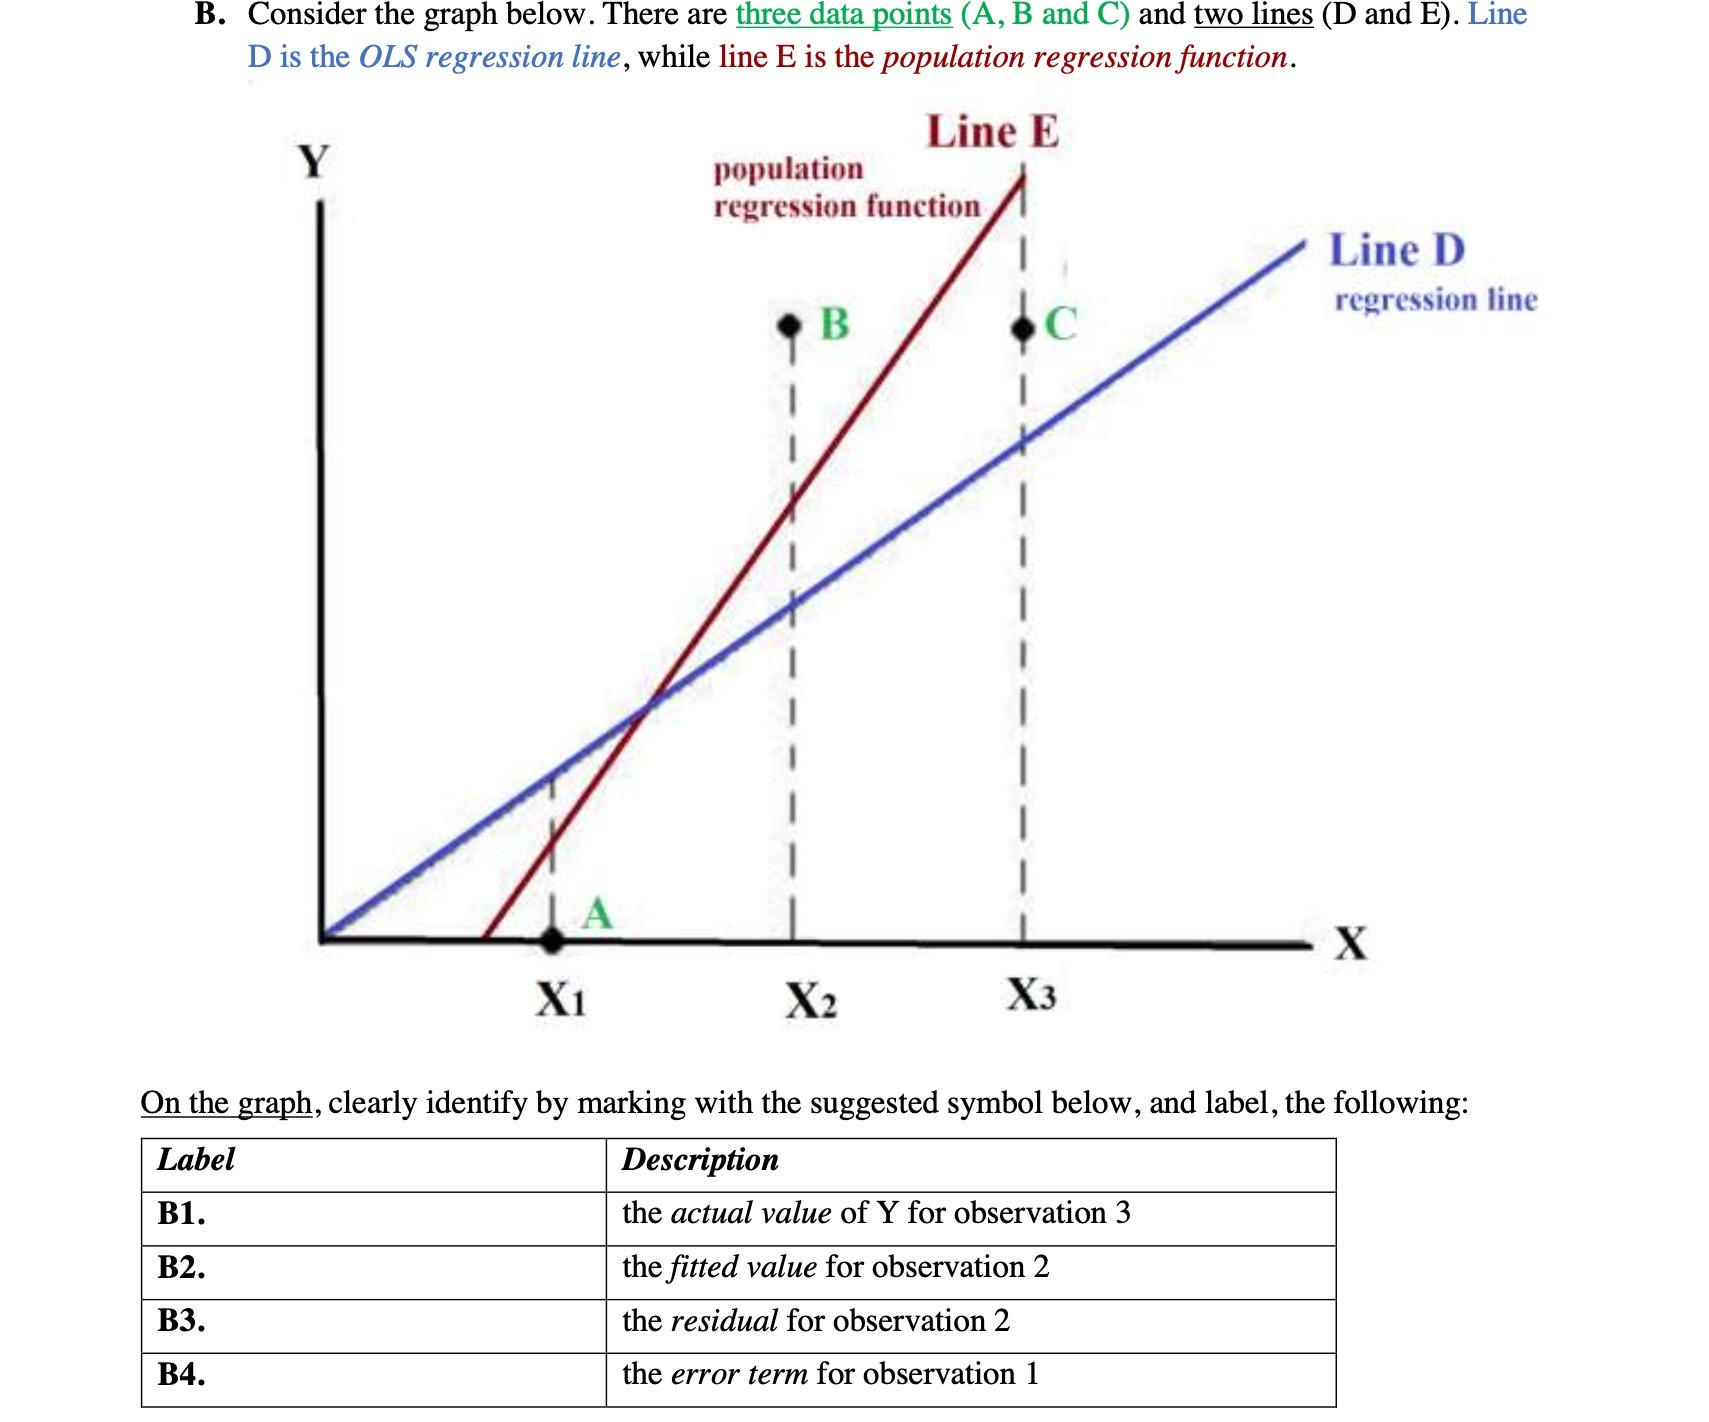
B. Consider the graph below. There are three data points (A, B and C) and two lines (D and E). Line D is the OLS regression line, while line B is the population regression function. L' E Y population we regression function w B | Line D regression line X X1 X2 X3 On the graph, clearly identify by marking with the suggested symbol below, and label, the following: Label Description B1. the actual value of Y for observation 3 _ the tted value for observation 2 B3. the residual for observation 2 B4. the error term for observation 1
Step by Step Solution
There are 3 Steps involved in it
1 Expert Approved Answer
Step: 1 Unlock

Question Has Been Solved by an Expert!
Get step-by-step solutions from verified subject matter experts
Step: 2 Unlock
Step: 3 Unlock