

Question: b. Construct a similar table as that displayed above, by computing the annual growth rates of the CPI by location and over the time horizons
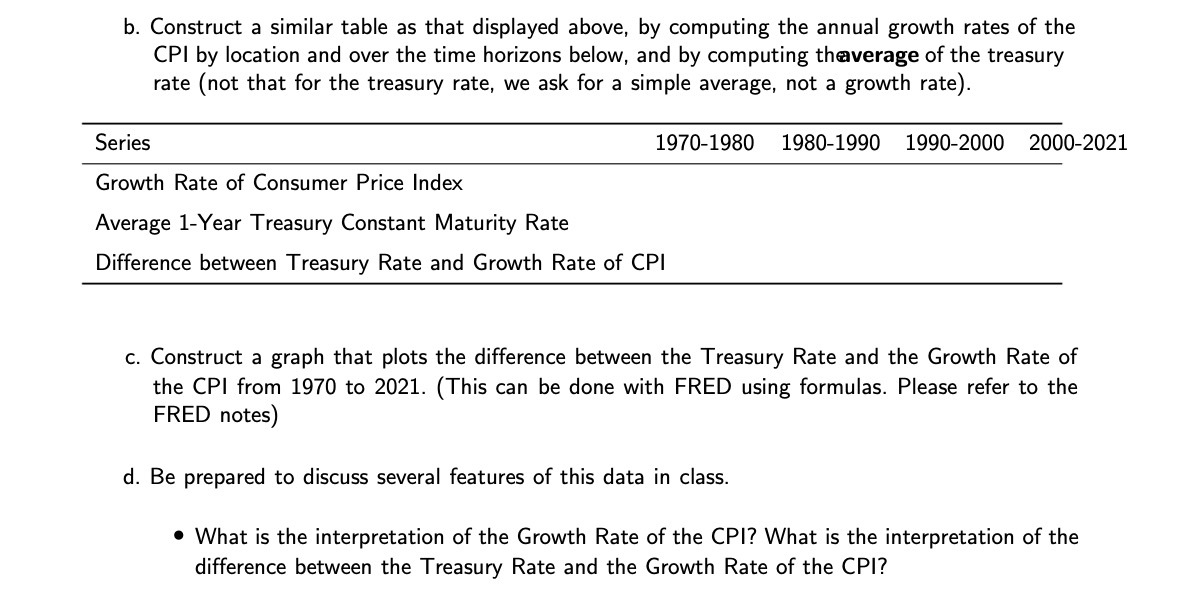

b. Construct a similar table as that displayed above, by computing the annual growth rates of the CPI by location and over the time horizons below, and by computing thaverage of the treasury rate (not that for the treasury rate, we ask for a simple average, not a growth rate). Series 1970-1980 1980-1990 1990-2000 2000-2021 Growth Rate of Consumer Price Index Average 1-Year Treasury Constant Maturity Rate Difference between Treasury Rate and Growth Rate of CPI c. Construct a graph that plots the difference between the Treasury Rate and the Growth Rate of the CPI from 1970 to 2021. (This can be done with FRED using formulas. Please refer to the FRED notes) d. Be prepared to discuss several features of this data in class. 0 What is the interpretation of the Growth Rate of the CPI? What is the interpretation of the difference between the Treasury Rate and the Growth Rate of the CPI
Step by Step Solution
There are 3 Steps involved in it

Get step-by-step solutions from verified subject matter experts