

Question: B. Critical values C. Identify P-Value and interpret the resultD. What assumptions need to be made in order to perform this procedure?Answer within 15 minutes
B. Critical values C. Identify P-Value and interpret the resultD. What assumptions need to be made in order to perform this procedure?Answer within 15 minutes
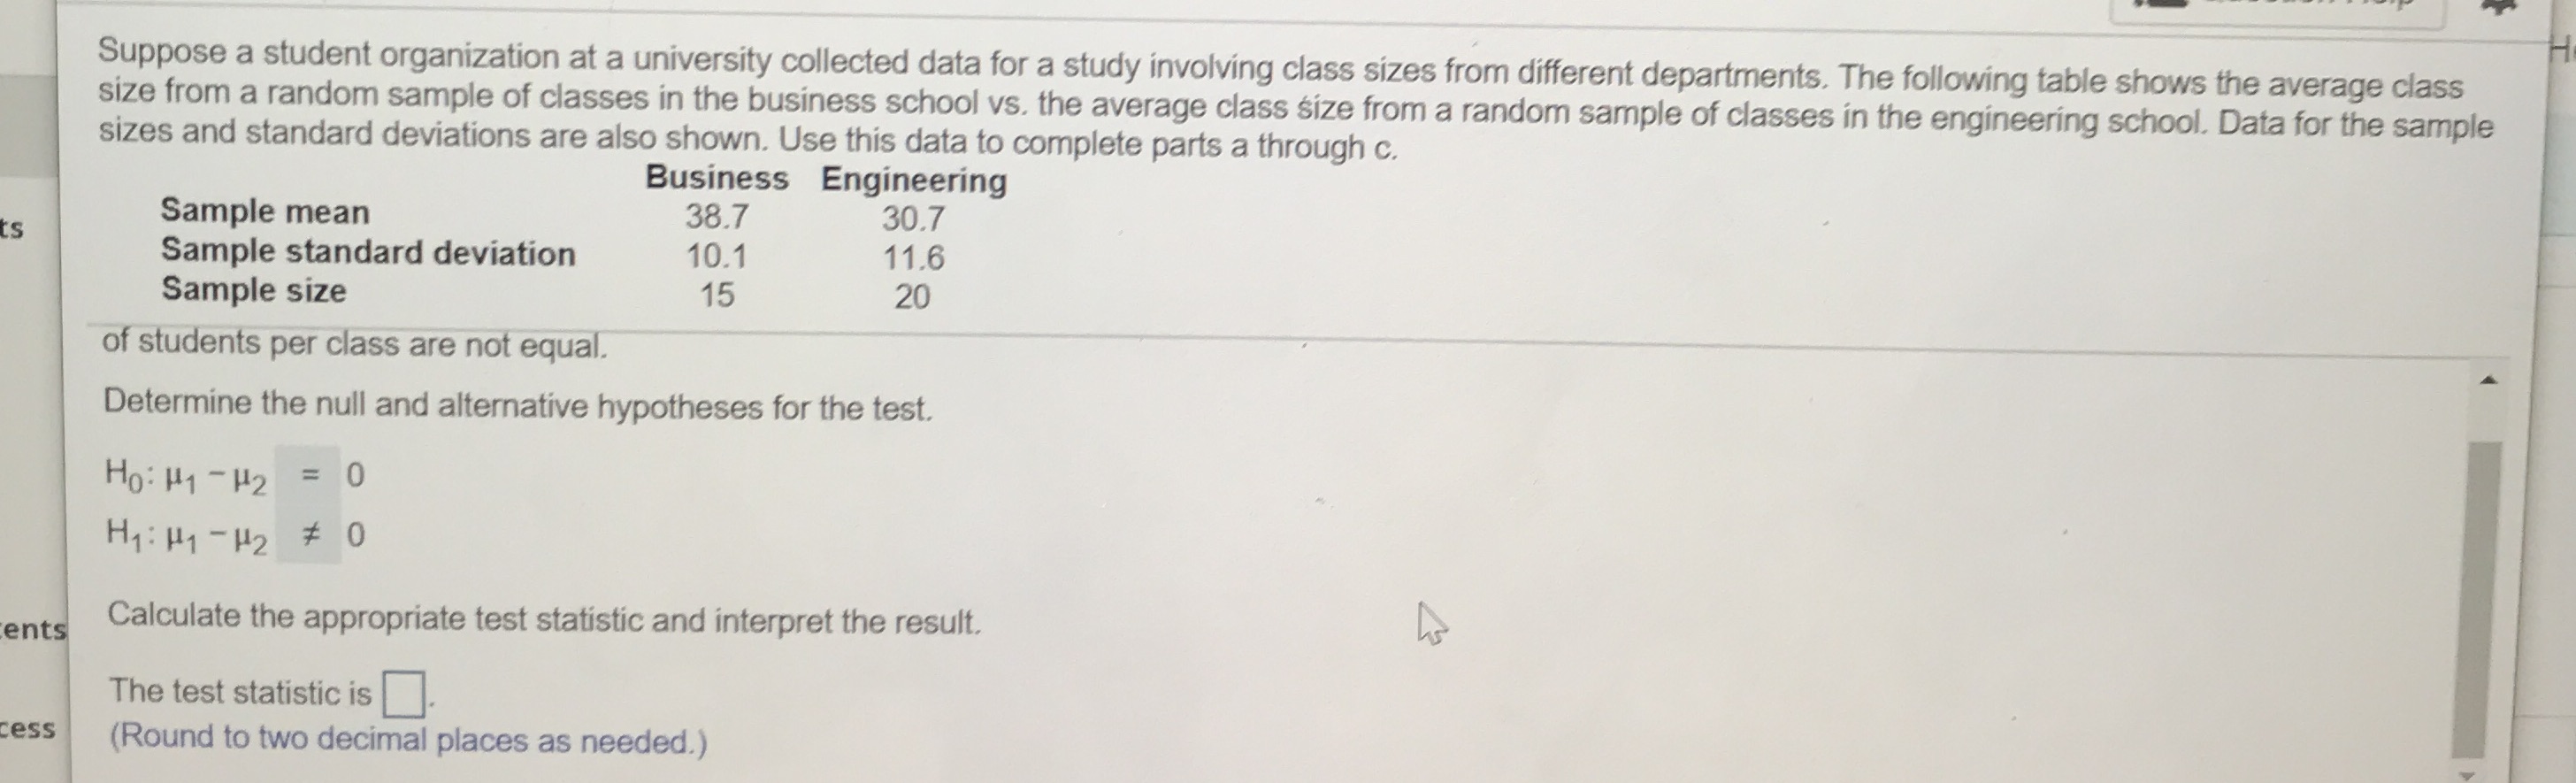
Suppose a student organization at a university collected data for a study involving class sizes from different departments. The following table shows the average class size from a random sample of classes in the business school vs. the average class size from a random sample of classes in the engineering school. Data for the sample sizes and standard deviations are also shown. Use this data to complete parts a through c. Business Engineering Sample mean 38.7 30.7 Sample standard deviation 10.1 11.6 Sample size 15 20 of students per class are not equal. Determine the null and alternative hypotheses for the test. Ho: H1 - H2 = 0 H1: 141 - H2 # 0 ents Calculate the appropriate test statistic and interpret the result. The test statistic is cess (Round to two decimal places as needed.)
Step by Step Solution
There are 3 Steps involved in it

Get step-by-step solutions from verified subject matter experts