

Question: b) Determine Flintstone and Rubble Bronto Crane Services' 1.) Current Cash Debt Coverage, 2.) Cash Coverage and 3.) Free Cash Flow for 2018 and 2019
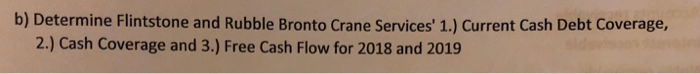
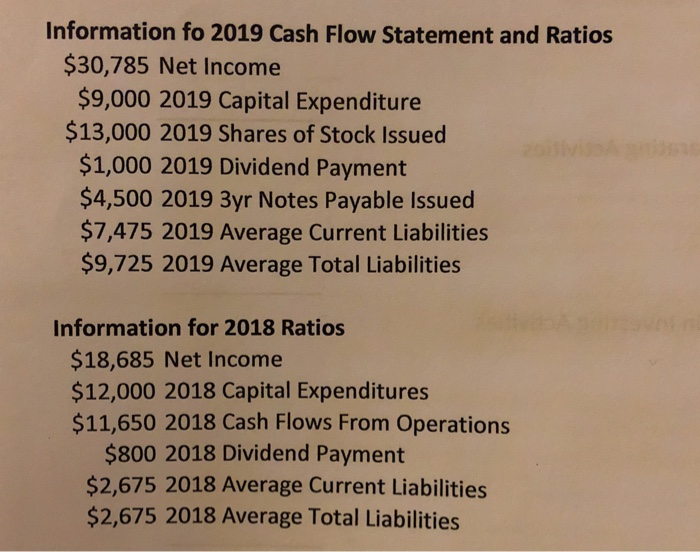
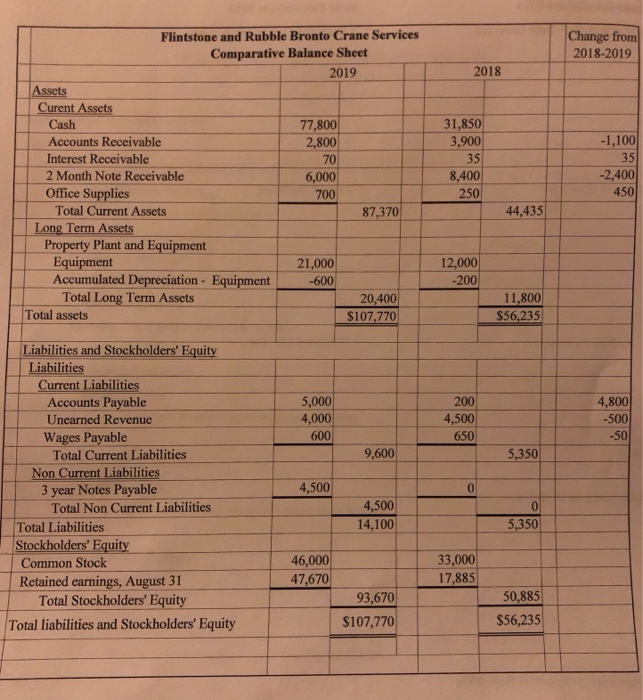
b) Determine Flintstone and Rubble Bronto Crane Services' 1.) Current Cash Debt Coverage, 2.) Cash Coverage and 3.) Free Cash Flow for 2018 and 2019 Information fo 2019 Cash Flow Statement and Ratios $30,785 Net Income $9,000 2019 Capital Expenditure $13,000 2019 Shares of Stock Issued $1,000 2019 Dividend Payment $4,500 2019 3yr Notes Payable Issued $7,475 2019 Average Current Liabilities $9,725 2019 Average Total Liabilities Information for 2018 Ratios $18,685 Net Income $12,000 2018 Capital Expenditures $11,650 2018 Cash Flows From Operations $800 2018 Dividend Payment $2,675 2018 Average Current Liabilities $2,675 2018 Average Total Liabilities Flintstone and Rubble Bronto Crane Services Comparative Balance Sheet Change fronm 2018-2019 2019 2018 ssets Cash Accounts Receivable Interest Receivable 2 Month Note Receivable Office Supplies 31,850 77,800 2,800 70 6,000 700 35 8,400 250 -1,100 35 -2,400 450 Total Current Assets 87,370 44,435 Long Term Assets Property Plant and Equipment Equipment Accumulated Depreciation Equipment-600 12,000 200 21,000 11,800 $56,235 Total Long Term Assets 20,400 $107,770 Total assets Liabilities and Stockholders' Equity Liabilities Current Liabilities Accounts Payable Unearned Revenue Wages Payable Total Current Liabilities 5,000 4,000 600 200 4,500 650 4,800 -500 50 9,600 5,350 Non Current Liabilities 3 year Notes Payable 4,500 0 4,500 14,100 Total Non Current Liabilities Total Liabilities 5,350 Stockholders' Equity Common Stock 46,000 47,670 33,000 17,885 Retained earnings, August 31 Total Stockholders' Equity Total liabilities and Stockholders' Equity 93,670 $107,770 50,885 $56,235
Step by Step Solution
There are 3 Steps involved in it

Get step-by-step solutions from verified subject matter experts