

Question: B: Empirical Analysis Here, we will extend the analyses we started in Homework 5 to consider the questions of covariate balance and potential confounding. As
B: Empirical Analysis
Here, we will extend the analyses we started in Homework to consider the questions of covariate balance and potential confounding. As we've stated, if Project STAR really was a clean RCT the answers to these questions should be clear. We will limit our analysis to the kindergarten class.
Overlap
Let's start by creating a table of summary statistics for the test score variable and key student and teacher characteristics. Again, only focusing on the kingergarten class.
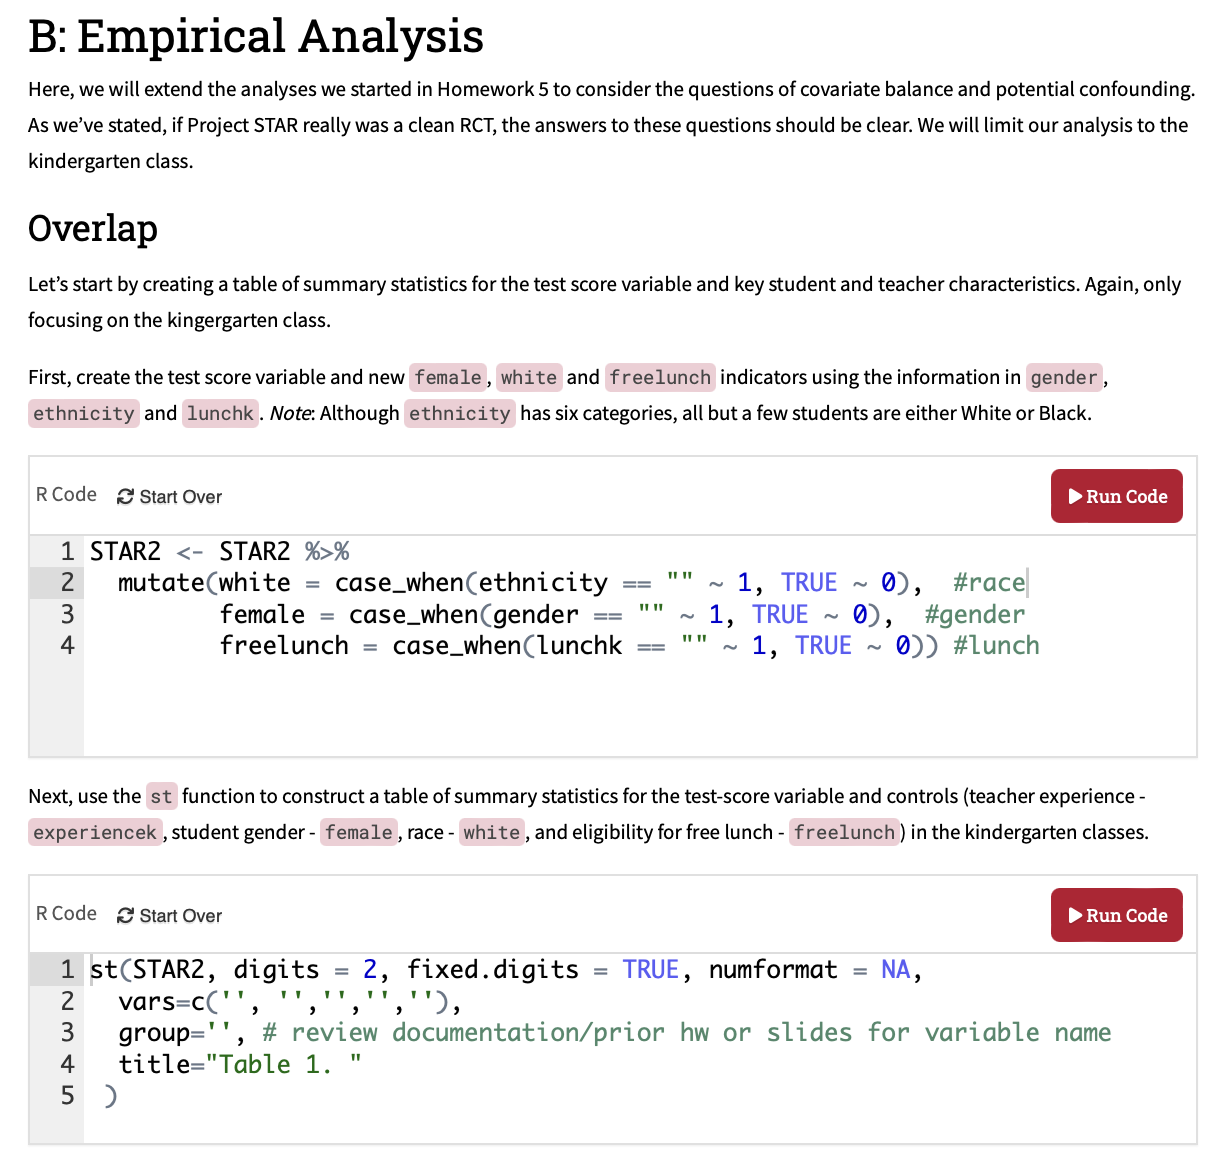
First, create the test score variable and new female, white and freelunch indicators using the information in gender, ethnicity and lunchk. Note: Although ethnicity has six categories, all but a few students are either White or Black.
STAR STAR
mutatewhite casewhenethnicity ~ TRUE ~ #race
female casewhengender ~ TRUE ~ #gender
freelunch casewhenlunchk ~ TRUE ~ #lunch
Next, use the st function to construct a table of summary statistics for the testscore variable and controls teacher experience experiencek, student gender female, race white, and eligibility for free lunch freelunch in the kindergarten classes.
stSTAR digits fixed.digits TRUE, numformat NA
varsc
group # review documentationprior hw or slides for variable name
title"Table
Step by Step Solution
There are 3 Steps involved in it
1 Expert Approved Answer
Step: 1 Unlock

Question Has Been Solved by an Expert!
Get step-by-step solutions from verified subject matter experts
Step: 2 Unlock
Step: 3 Unlock