

Question: (b) Explain what each of the elements of the Python instruction below achieves: import numpy as np USDJPYHistoricalData ['logReturns'] = (np.log(USDJPYHistoricalData ['Spot'])). $operatorname{diff} ($ (c)
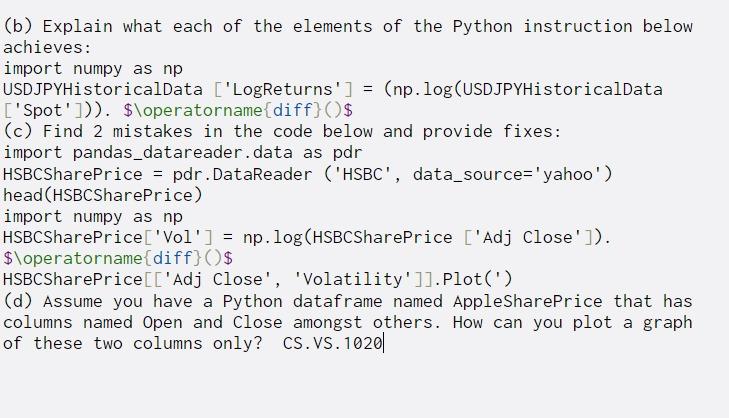
(b) Explain what each of the elements of the Python instruction below achieves: import numpy as np USDJPYHistoricalData ['logReturns'] = (np.log(USDJPYHistoricalData ['Spot'])). $\operatorname{diff} ($ (c) Find 2 mistakes in the code below and provide fixes: import pandas_datareader.data as pdr HSBCSharePrice = pdr. DataReader ('HSBC', data_source='yahoo') head(HSBCSharePrice) import numpy as np HSBCSharePrice['Vol'] = np.log(HSBCSharePrice ['Adj Close']). $\operatorname{diff) ($ HSBCSharePrice[['Adj Close', 'Volatility']).plot(') (d) Assume you have a Python dataframe named AppleSharePrice that has columns named Open and close amongst others. How can you plot a graph of these two columns only? CS.VS.1020||
Step by Step Solution
There are 3 Steps involved in it

Get step-by-step solutions from verified subject matter experts