

Question: (b) Figure Q3(b) shows a Bode magnitude and phase plot for a stable second order system. Based on the information given in the figure
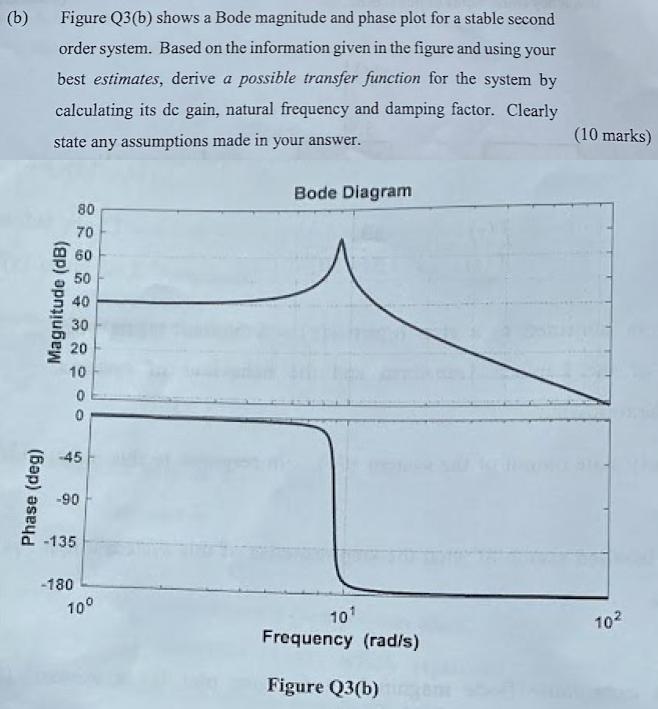
(b) Figure Q3(b) shows a Bode magnitude and phase plot for a stable second order system. Based on the information given in the figure and using your best estimates, derive a possible transfer function for the system by calculating its dc gain, natural frequency and damping factor. Clearly state any assumptions made in your answer. (10 marks) Bode Diagram 80 70 60 50 40 30 20 10 -45 -90 -135 -180 100 101 Frequency (rad/s) 102 Figure Q3(b)gen Phase (deg) Magnitude (dB)
Step by Step Solution
There are 3 Steps involved in it
The transfer function of a stable s... View full answer

Get step-by-step solutions from verified subject matter experts