

Question: (b) Figure Q4b. shows a graph of the function y = 2x3 between the limits 0 - 3. (x - axis) and 0 - 60

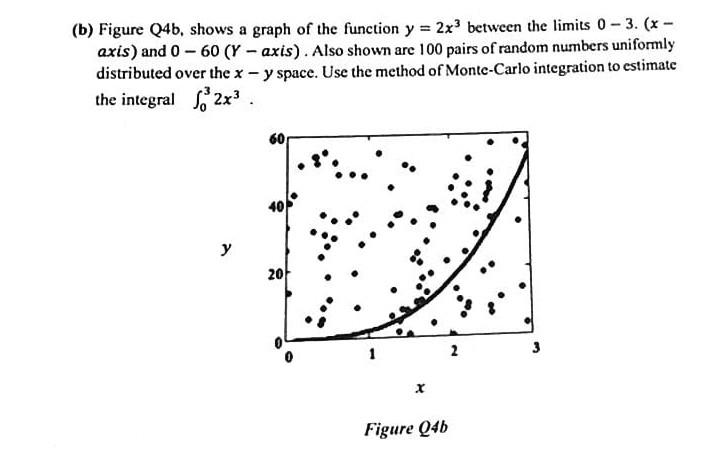
(b) Figure Q4b. shows a graph of the function y = 2x3 between the limits 0 - 3. (x - axis) and 0 - 60 (Y - axis) . Also shown are 100 pairs of random numbers uniformly distributed over the x - y space. Use the method of Monte-Carlo integration to estimate the integral So 2x3 . 60 40 20 X Figure Q4b
Step by Step Solution
There are 3 Steps involved in it
1 Expert Approved Answer
Step: 1 Unlock

Question Has Been Solved by an Expert!
Get step-by-step solutions from verified subject matter experts
Step: 2 Unlock
Step: 3 Unlock