

Question: b. Fill in the ANOVA table with the missing values. Source of Variation SS df MS F-ratio P-value Between groups 456 2 228 2.516
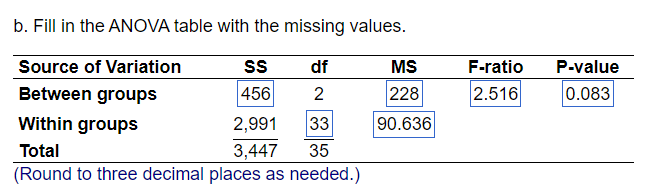
b. Fill in the ANOVA table with the missing values. Source of Variation SS df MS F-ratio P-value Between groups 456 2 228 2.516 0.083 Within groups 2,991 33 90.636 Total 3,447 35 (Round to three decimal places as needed.)
Step by Step Solution
There are 3 Steps involved in it
1 Expert Approved Answer
Step: 1 Unlock

Question Has Been Solved by an Expert!
Get step-by-step solutions from verified subject matter experts
Step: 2 Unlock
Step: 3 Unlock