

Question: B flee Update To keep up-to-date with security updates, fixes, and Improvements, choose Check for Updates. choose me ADove Cran opoon. Replace chant The WITT
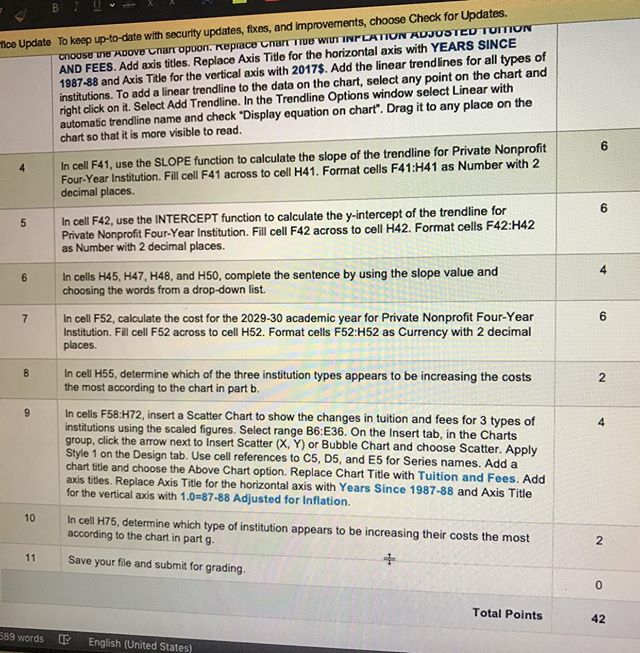
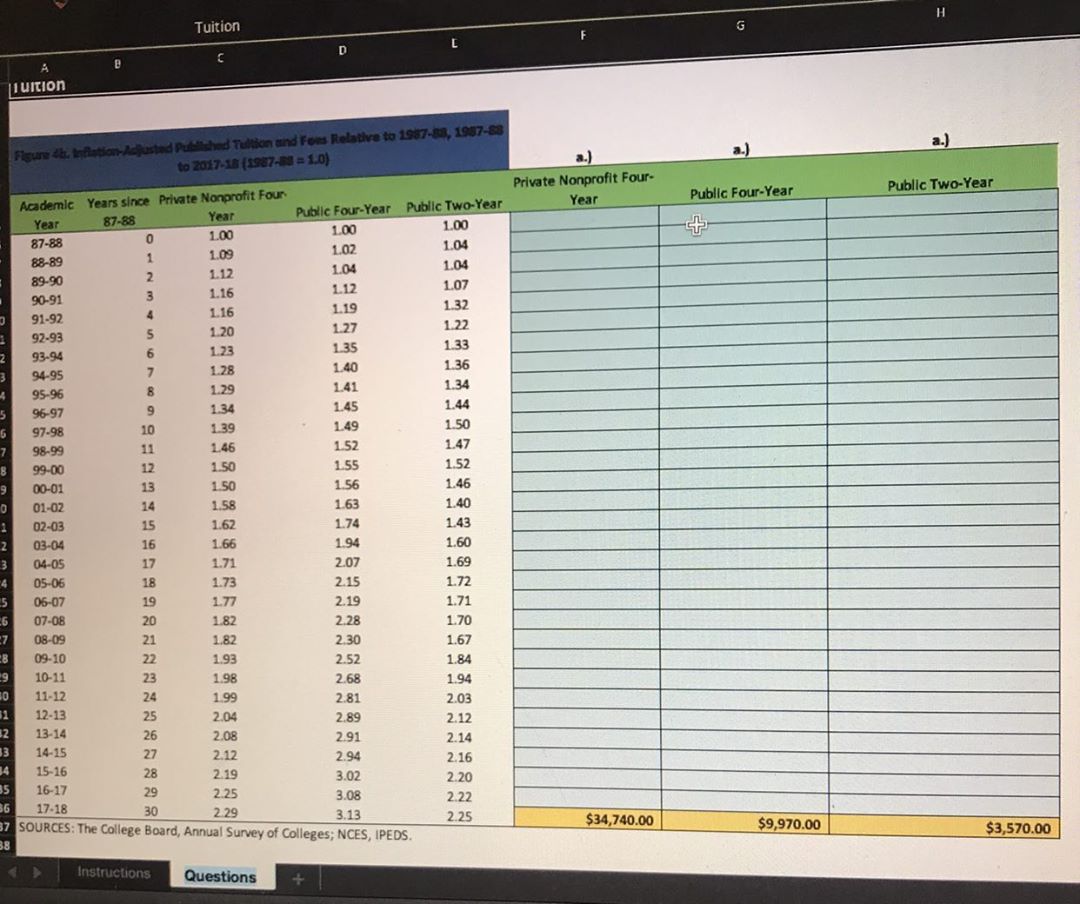
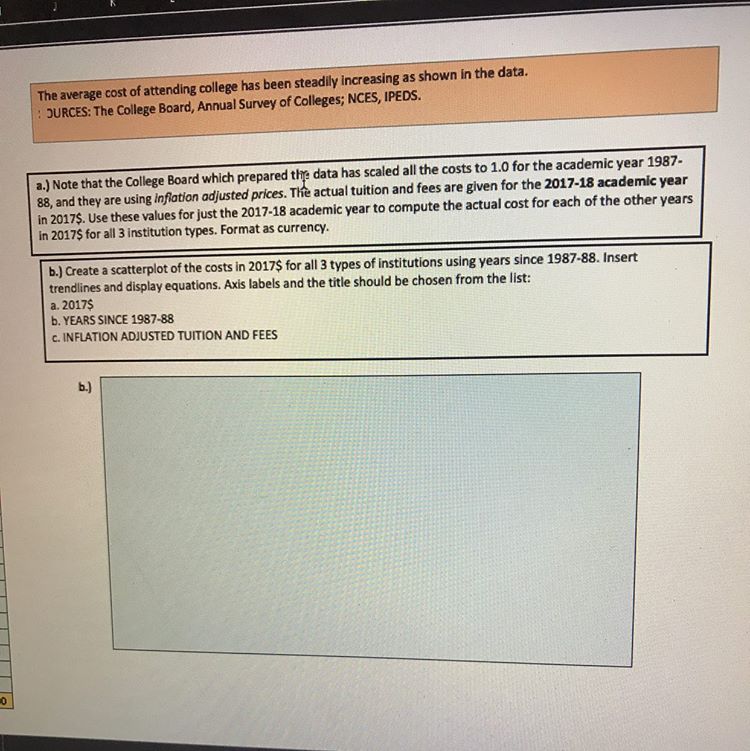
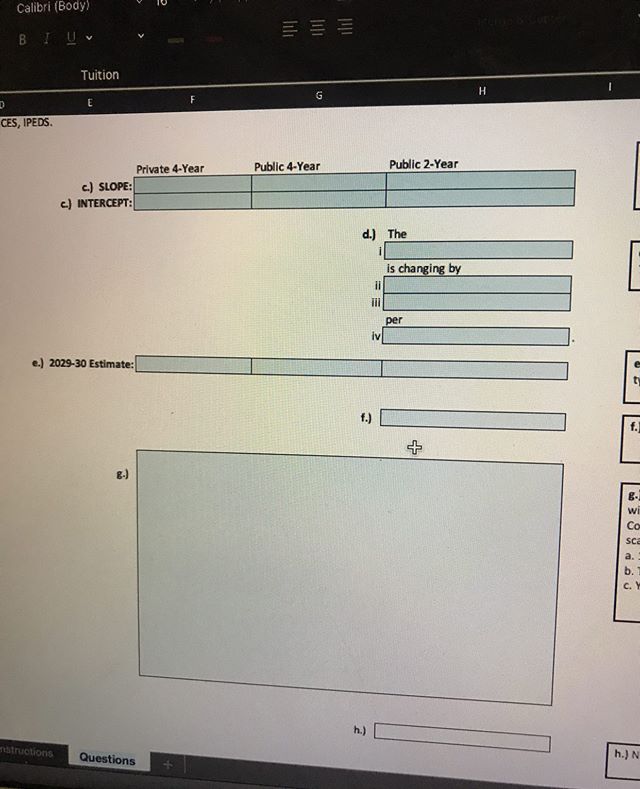
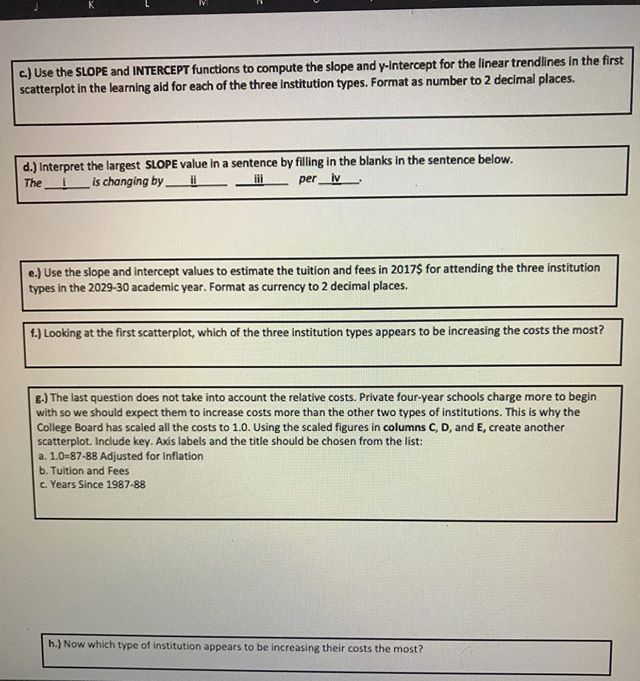
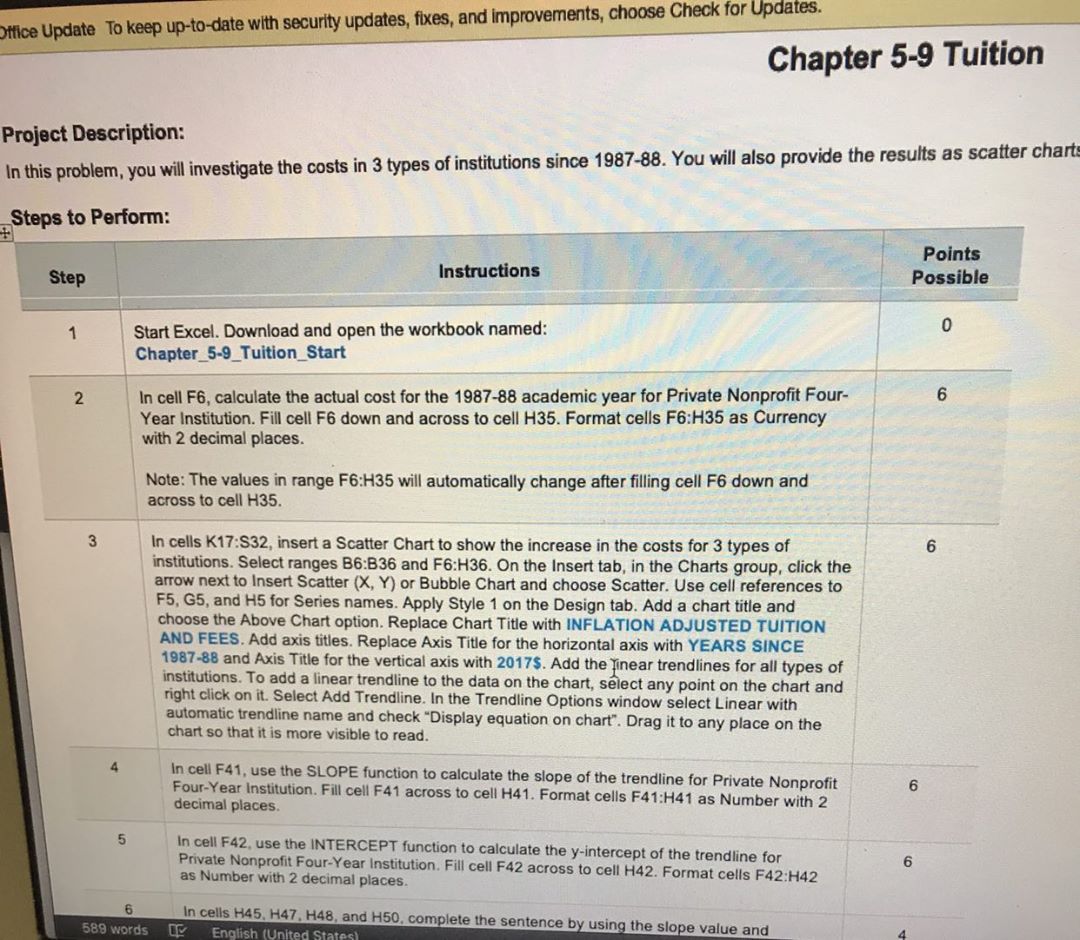
B flee Update To keep up-to-date with security updates, fixes, and Improvements, choose Check for Updates. choose me ADove Cran opoon. Replace chant The WITT INFLATION ADJUSTED TUMTION AND FEES. Add axis titles. Replace Axis Title for the horizontal axis with YEARS SINCE 1987-88 and Axis Title for the vertical axis with 2017$. Add the linear trendlines for all types of institutions. To add a linear trendline to the data on the chart, select any point on the chart and right click on it. Select Add Trendline. In the Trendline Options window select Linear with automatic trendline name and check "Display equation on chart". Drag it to any place on the chart so that it is more visible to read. In cell F41, use the SLOPE function to calculate the slope of the trendline for Private Nonprofit 6 Four-Year Institution. Fill cell F41 across to cell H41. Format cells F41:H41 as Number with 2 decimal places. 5 In cell F42, use the INTERCEPT function to calculate the y-intercept of the trendline for 6 Private Nonprofit Four-Year Institution. Fill cell F42 across to cell H42. Format cells F42:H42 as Number with 2 decimal places. 6 In cells H45, H47, H48, and H50, complete the sentence by using the slope value and 4 choosing the words from a drop-down list. 7 In cell F52, calculate the cost for the 2029-30 academic year for Private Nonprofit Four-Year Institution. Fill cell F52 across to cell H52. Format cells F52:H52 as Currency with 2 decimal 6 places. In cell H55, determine which of the three institution types appears to be increasing the costs the most according to the chart in part b. 2 9 In cells F58:H72, insert a Scatter Chart to show the changes in tuition and fees for 3 types of institutions using the scaled figures. Select range B6:E36. On the Insert tab, in the Charts group, click the arrow next to Insert Scatter (X, Y) or Bubble Chart and choose Scatter. Apply Style 1 on the Design tab. Use cell references to C5, D5, and E5 for Series names. Add a chart title and choose the Above Chart option. Replace Chart Title with Tuition and Fees. Add axis titles. Replace Axis Title for the horizontal axis with Years Since 1987-88 and Axis Title for the vertical axis with 1.0=87-88 Adjusted for Inflation. 10 In cell H75, determine which type of institution appears to be increasing their costs the most according to the chart in part g- 11 IN Save your file and submit for grading. O Total Points 589 words 42 English (United States)Tuition D LIUItion Figure 4h. Inflation-Adjusted Published Tultion and Fous Relative to 1987-83, 1957-83 a.) a.) to 2017-18 (1987-18 = 1.0) a.) Private Nonprofit Four- Academic Years since Private Nonprofit Four Year Public Four-Year Public Two-Year Year 87-88 Year Public Four-Year Public Two-Year 1.00 87-88 88-89 WaWNNO 1.00 1.00 1.09 1.02 1.0 89-90 1.12 104 1.04 90-91 1.16 1.12 1.07 1-92 1.16 1.19 1.32 92-93 1.20 1.27 1.22 93-94 123 1.35 1.33 94-95 1.28 1.40 1.36 95-9 1.29 141 1.34 96-97 9 1.34 1.45 1.44 97-98 10 1 39 149 1.50 98-99 11 146 1.52 1.47 99-00 12 1.50 1.55 1.52 00-01 13 1.50 1.56 1.46 01-02 14 1.58 1.63 1.40 02-03 15 1.62 1.74 1.43 03-04 16 1.66 1.94 1.60 04-05 17 1.71 2.07 1.69 05-06 18 1.73 2.15 1.72 06-07 19 1.77 2.19 1.71 07-08 20 182 2.28 1.70 08-09 21 1,82 2.30 1.67 09-10 22 1.93 2.52 1 84 10-1 23 198 2.68 194 11-12 24 1 99 2.81 2.03 12-13 25 2.04 2.89 13-14 2.12 26 2.08 2.91 14-15 27 2.14 2.12 15-16 2.94 28 2.16 2.19 16-17 3.02 29 2.20 2.25 17-18 3.08 2.29 2.22 3.13 SOURCES: The College Board, Annual Survey of Colleges; NCES, IPEDS. 2.25 $34,740.00 $9,970.00 $3,570.00 Instructions QuestionsThe average cost of attending college has been steadily increasing as shown in the data. : JURCES: The College Board, Annual Survey of Colleges; NCES, IPEDS. a.) Note that the College Board which prepared the data has scaled all the costs to 1.0 for the academic year 1987- 88, and they are using inflation adjusted prices. The actual tuition and fees are given for the 2017-18 academic year in 2017$. Use these values for just the 2017-18 academic year to compute the actual cost for each of the other years in 2017$ for all 3 institution types. Format as currency. b.) Create a scatterplot of the costs in 2017$ for all 3 types of institutions using years since 1987-88. Insert trendlines and display equations. Axis labels and the title should be chosen from the list: a. 2017$ b. YEARS SINCE 1987-88 C. INFLATION ADJUSTED TUITION AND FEESCalibri (Body) B E Tuition E G H CES, IPEDS. Private 4-Year Public 4-Year Public 2-Year c.) SLOPE: c.) INTERCEPT: d.) The is changing by per e.) 2029-30 Estimate: f.) + DUPHOER h. ) atructions Questions h.)c.) Use the SLOPE and INTERCEPT functions to compute the slope and y-intercept for the linear trendlines in the first scatterplot in the learning aid for each of the three Institution types. Format as number to 2 decimal places. d.) Interpret the largest SLOPE value in a sentence by filling in the blanks in the sentence below. The Is changing by _ lii per_iv e.) Use the slope and Intercept values to estimate the tuition and fees in 2017$ for attending the three institution types in the 2029-30 academic year. Format as currency to 2 decimal places. f.) Looking at the first scatterplot, which of the three institution types appears to be increasing the costs the most? g.) The last question does not take into account the relative costs. Private four-year schools charge more to begin with so we should expect them to increase costs more than the other two types of institutions. This is why the College Board has scaled all the costs to 1.0. Using the scaled figures in columns C, D, and E, create another scatterplot. Include key. Axis labels and the title should be chosen from the list: a. 1.0=87-88 Adjusted for Inflation b. Tuition and Fees c. Years Since 1987-88 h.) Now which type of Institution appears to be increasing their costs the most?Office Update To keep up-to-date with security updates, fixes, and improvements, choose Check for Updates. Chapter 5-9 Tuition Project Description: In this problem, you will investigate the costs in 3 types of institutions since 1987-88. You will also provide the results as scatter chart Steps to Perform: Points Step Instructions Possible 1 Start Excel. Download and open the workbook named: O Chapter_5-9_Tuition_Start 2 In cell F6, calculate the actual cost for the 1987-88 academic year for Private Nonprofit Four- Year Institution. Fill cell F6 down and across to cell H35. Format cells F6:H35 as Currency with 2 decimal places. Note: The values in range F6:H35 will automatically change after filling cell F6 down and across to cell H35. 3 In cells K17:$32, insert a Scatter Chart to show the increase in the costs for 3 types of 6 institutions. Select ranges B6:B36 and F6:H36. On the Insert tab, in the Charts group, click the arrow next to Insert Scatter (X, Y) or Bubble Chart and choose Scatter. Use cell references to F5, G5, and H5 for Series names. Apply Style 1 on the Design tab. Add a chart title and choose the Above Chart option. Replace Chart Title with INFLATION ADJUSTED TUITION AND FEES. Add axis titles. Replace Axis Title for the horizontal axis with YEARS SINCE 1987-88 and Axis Title for the vertical axis with 2017$. Add the Tinear trendlines for all types of institutions. To add a linear trendline to the data on the chart, select any point on the chart and right click on it. Select Add Trendline. In the Trendline Options window select Linear with automatic trendline name and check "Display equation on chart". Drag it to any place on the chart so that it is more visible to read. In cell F41, use the SLOPE function to calculate the slope of the trendline for Private Nonprofit Four-Year Institution. Fill cell F41 across to cell H41. Format cells F41:H41 as Number with 2 6 decimal places. 5 In cell F42, use the INTERCEPT function to calculate the y-intercept of the trendline for Private Nonprofit Four-Year Institution. Fill cell F42 across to cell H42. Format cells F42:H42 6 as Number with 2 decimal places. 6 589 words In cells H45, H47, H48, and H50, complete the sentence by using the slope value and
Step by Step Solution
There are 3 Steps involved in it

Get step-by-step solutions from verified subject matter experts