

Question: b) Here is a dot plot of the mean volumes of 50 randomly selected 6packs of soda. Plot your mean volume in the dot plot.
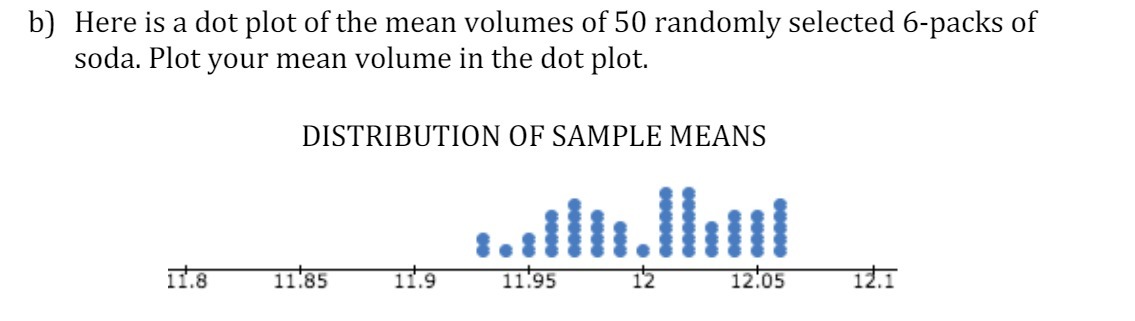
b) Here is a dot plot of the mean volumes of 50 randomly selected 6packs of soda. Plot your mean volume in the dot plot. DISTRIBUTION OF SAMPLE MEANS I. .8 11.35 .9 11. 95 12. 05 1 .1
Step by Step Solution
There are 3 Steps involved in it
1 Expert Approved Answer
Step: 1 Unlock

Question Has Been Solved by an Expert!
Get step-by-step solutions from verified subject matter experts
Step: 2 Unlock
Step: 3 Unlock