

Question: (b) How much of the variation in the sample values of weekly gross revenue does the model in part (a) explain? If required, round your
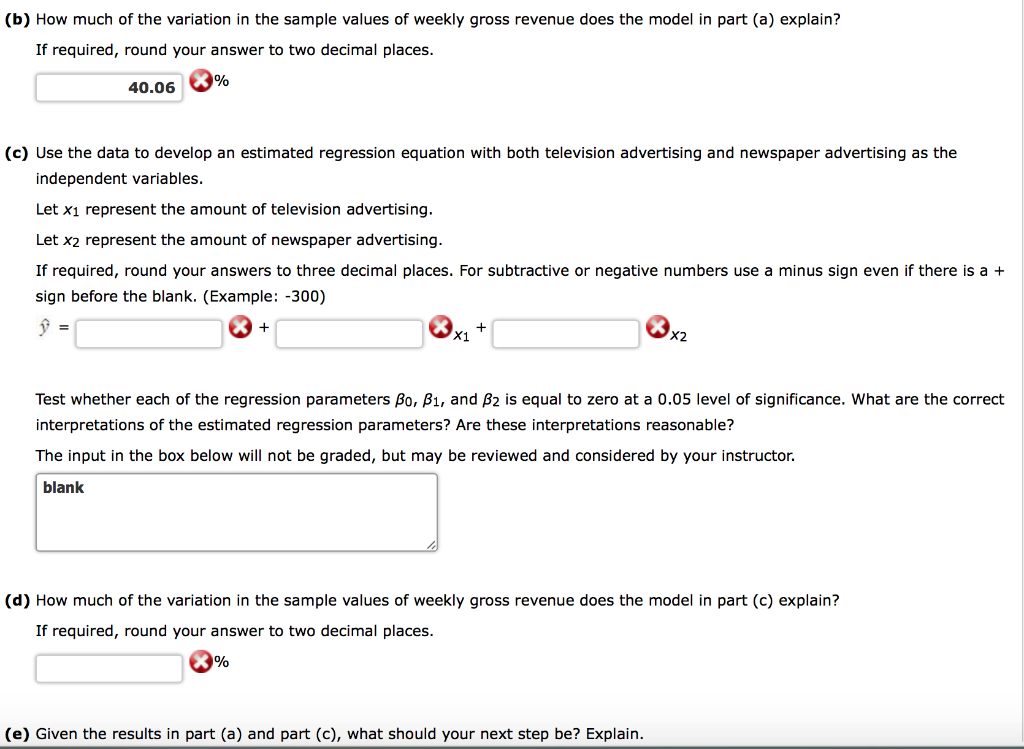
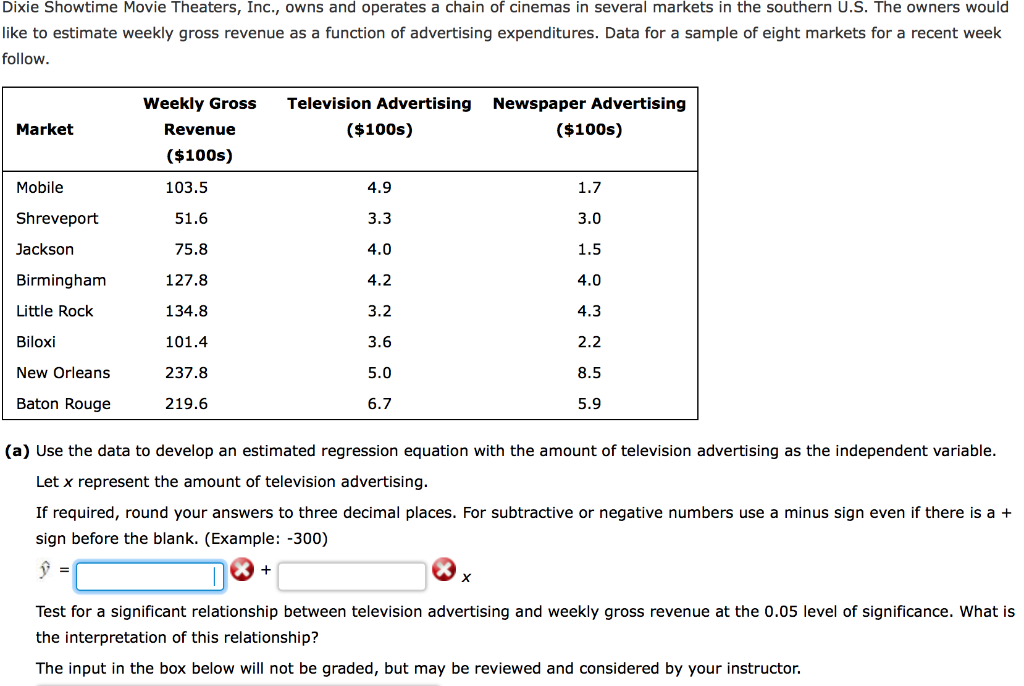
(b) How much of the variation in the sample values of weekly gross revenue does the model in part (a) explain? If required, round your answer to two decimal places. 40.06 % (c) Use the data to develop an estimated regression equation with both television advertising and newspaper advertising as the independent variables. Let x1 represent the amount of television advertising. Let x2 represent the amount of newspaper advertising. If required, round your answers to three decimal places. For subtractive or negative numbers use a minus sign even if there is a + sign before the blank. (Example: -300) X + + Test whether each of the regression parameters Bo, B1, and B2 is equal to zero at a 0.05 level of significance. What are the correct interpretations of the estimated regression parameters? Are these interpretations reasonable? The input in the box below will not be graded, but may be reviewed and considered by your instructor. blank (d) How much of the variation in the sample values of weekly gross revenue does the model in part (c) explain? If required, round your answer to two decimal places. X % (e) Given the results in part (a) and part (c), what should your next step be? Explain. Dixie Showtime Movie Theaters, Inc., owns and operates a chain of cinemas in several markets in the southern U.S. The owners would like to estimate weekly gross revenue as a function of advertising expenditures. Data for a sample of eight markets for a recent week follow. Weekly Gross Revenue ($100s) Television Advertising Newspaper Advertising ($100s) ($100s) Market 4.9 Mobile Shreveport 103.5 51.6 75.8 3.3 4.0 Jackson Birmingham Little Rock 127.8 4.2 134.8 Biloxi 101.4 New Orleans 237.8 5.0 Baton Rouge 219.6 6.7 5.9 (a) Use the data to develop an estimated regression equation with the amount of television advertising as the independent variable. Let x represent the amount of television advertising. If required, round your answers to three decimal places. For subtractive or negative numbers use a minus sign even if there is a + sign before the blank. (Example: -300) 1 + Test for a significant relationship between television advertising and weekly gross revenue at the 0.05 level of significance. What is the interpretation of this relationship? The input in the box below will not be graded, but may be reviewed and considered by your instructor. (b) How much of the variation in the sample values of weekly gross revenue does the model in part (a) explain? If required, round your answer to two decimal places. 40.06 % (c) Use the data to develop an estimated regression equation with both television advertising and newspaper advertising as the independent variables. Let x1 represent the amount of television advertising. Let x2 represent the amount of newspaper advertising. If required, round your answers to three decimal places. For subtractive or negative numbers use a minus sign even if there is a + sign before the blank. (Example: -300) X + + Test whether each of the regression parameters Bo, B1, and B2 is equal to zero at a 0.05 level of significance. What are the correct interpretations of the estimated regression parameters? Are these interpretations reasonable? The input in the box below will not be graded, but may be reviewed and considered by your instructor. blank (d) How much of the variation in the sample values of weekly gross revenue does the model in part (c) explain? If required, round your answer to two decimal places. X % (e) Given the results in part (a) and part (c), what should your next step be? Explain. Dixie Showtime Movie Theaters, Inc., owns and operates a chain of cinemas in several markets in the southern U.S. The owners would like to estimate weekly gross revenue as a function of advertising expenditures. Data for a sample of eight markets for a recent week follow. Weekly Gross Revenue ($100s) Television Advertising Newspaper Advertising ($100s) ($100s) Market 4.9 Mobile Shreveport 103.5 51.6 75.8 3.3 4.0 Jackson Birmingham Little Rock 127.8 4.2 134.8 Biloxi 101.4 New Orleans 237.8 5.0 Baton Rouge 219.6 6.7 5.9 (a) Use the data to develop an estimated regression equation with the amount of television advertising as the independent variable. Let x represent the amount of television advertising. If required, round your answers to three decimal places. For subtractive or negative numbers use a minus sign even if there is a + sign before the blank. (Example: -300) 1 + Test for a significant relationship between television advertising and weekly gross revenue at the 0.05 level of significance. What is the interpretation of this relationship? The input in the box below will not be graded, but may be reviewed and considered by your instructor
Step by Step Solution
There are 3 Steps involved in it

Get step-by-step solutions from verified subject matter experts