

Question: B I U v Av E EE Merge & Center v $ ~ % 9 Conditional Format Cell Inser Formatting as Table Styles fx C

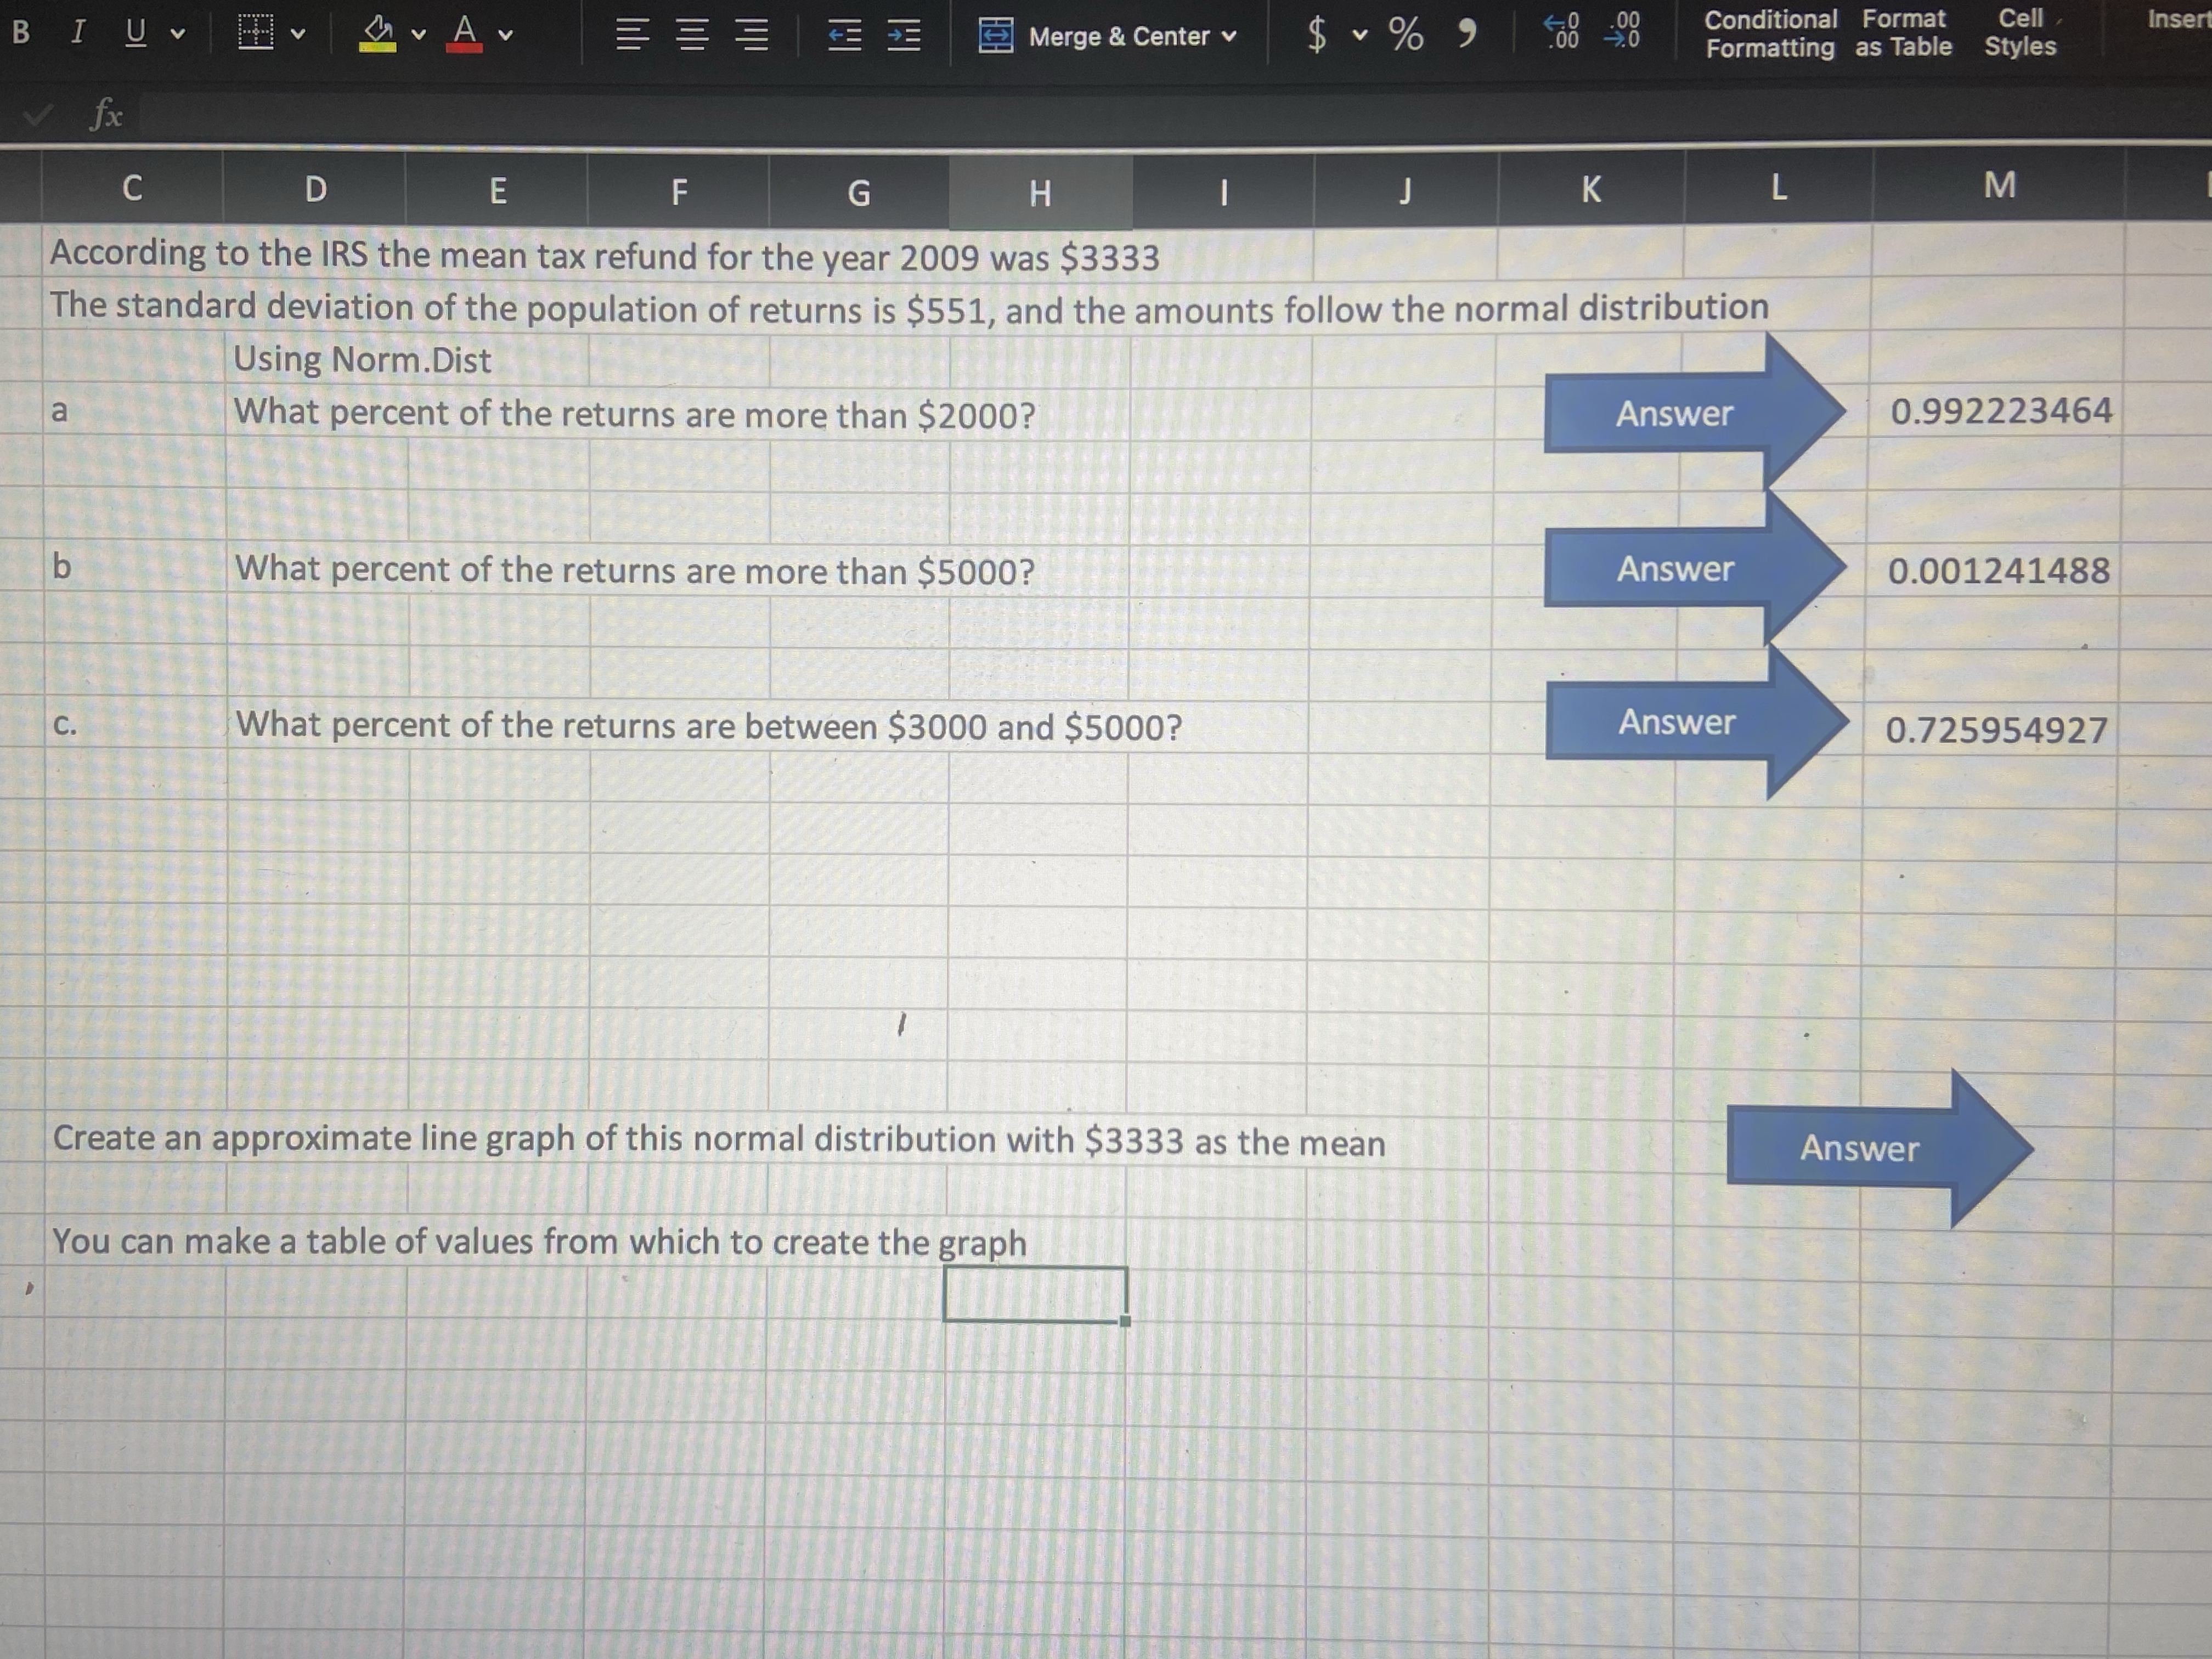
B I U v Av E EE Merge & Center v $ ~ % 9 Conditional Format Cell Inser Formatting as Table Styles fx C D E F G H K L M According to the IRS the mean tax refund for the year 2009 was $3333 The standard deviation of the population of returns is $551, and the amounts follow the normal distribution Using Norm. Dist a What percent of the returns are more than $2000? Answer 0.992223464 b What percent of the returns are more than $5000? Answer 0.001241488 C. What percent of the returns are between $3000 and $5000? Answer 0.725954927 Create an approximate line graph of this normal distribution with $3333 as the mean Answer You can make a table of values from which to create the graph
Step by Step Solution
There are 3 Steps involved in it

Get step-by-step solutions from verified subject matter experts