

Question: B. Identify the first milestone on the following graph, and explain your choice. Revenue Forecast $350,000 $300,000 $300,000 $250,000 $255,000 $212,550 I $200,000 Revenue $162,000
B. Identify the first milestone on the following graph, and explain your choice.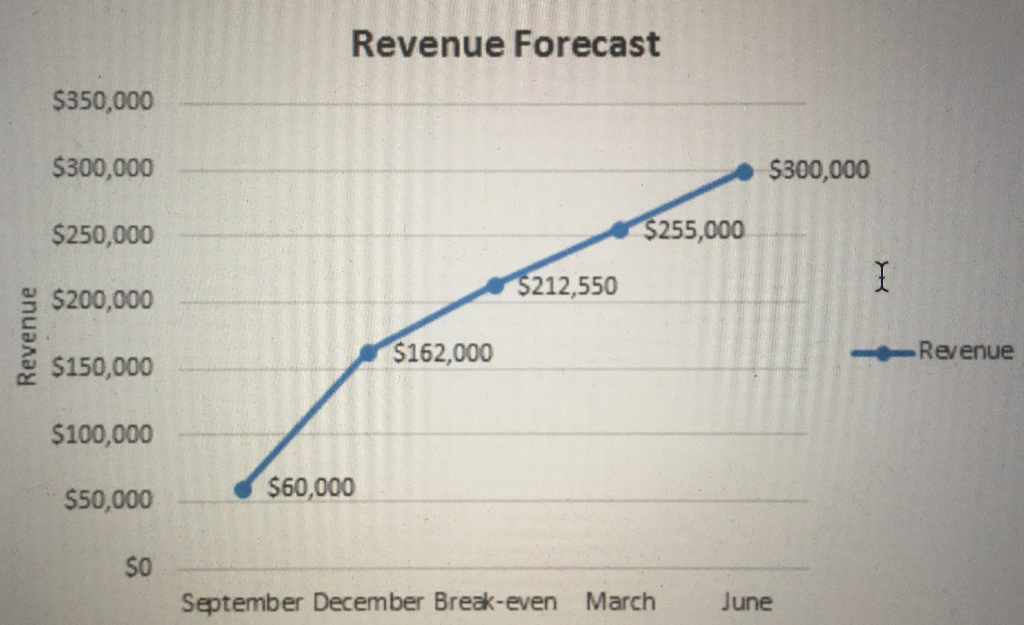
Revenue Forecast $350,000 $300,000 $300,000 $250,000 $255,000 $212,550 I $200,000 Revenue $162,000 Revenue $150,000 $100,000 $50,000 $60,000 SO September December Break-even March June
Step by Step Solution
There are 3 Steps involved in it
1 Expert Approved Answer
Step: 1 Unlock

Question Has Been Solved by an Expert!
Get step-by-step solutions from verified subject matter experts
Step: 2 Unlock
Step: 3 Unlock