

Question: B . K L M Z O P A E F Lab Exercise: Markowitz 3 Asset Portfolio Efficient Frontier Students are encouraged to work in
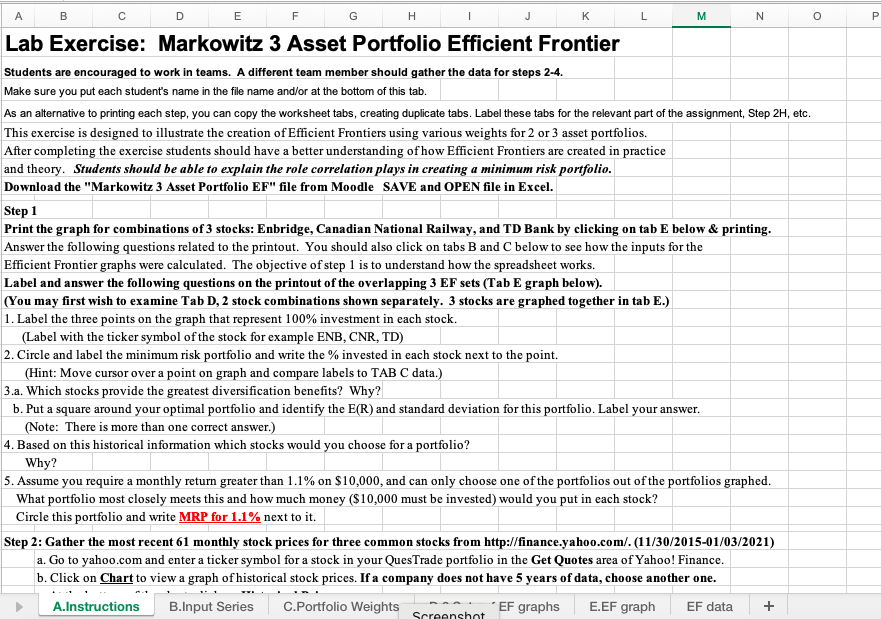
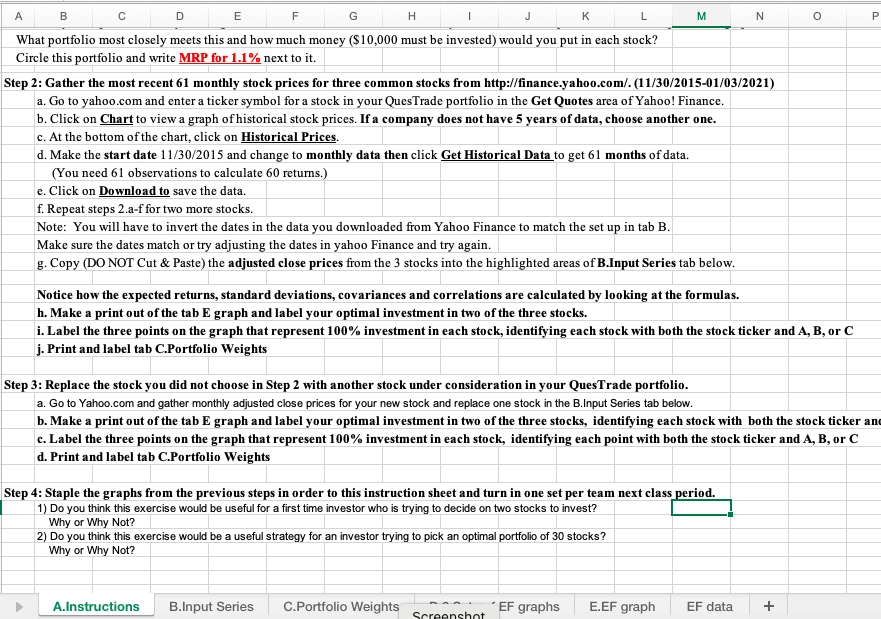
B . K L M Z O P A E F Lab Exercise: Markowitz 3 Asset Portfolio Efficient Frontier Students are encouraged to work in teams. A different team member should gather the data for steps 2-4. Make sure you put each student's name in the file name and/or at the bottom of this tab. As an alternative to printing each step, you can copy the worksheet tabs, creating duplicate tabs. Label these tabs for the relevant part of the assignment, Step 2H, etc. This exercise is designed to illustrate the creation of Efficient Frontiers using various weights for 2 or 3 asset portfolios. After completing the exercise students should have a better understanding of how Efficient Frontiers are created in practice and theory. Students should be able to explain the role correlation plays in creating a minimum risk portfolio. Download the "Markowitz 3 Asset Portfolio EF" file from Moodle SAVE and OPEN file in Excel. Step 1 Print the graph for combinations of 3 stocks: Enbridge, Canadian National Railway, and TD Bank by clicking on tab E below & printing. Answer the following questions related to the printout. You should also click on tabs B and C below to see how the inputs for the Efficient Frontier graphs were calculated. The objective of step 1 is to understand how the spreadsheet works. Label and answer the following questions on the printout of the overlapping 3 EF sets (Tab E graph below). (You may first wish to examine Tab D, 2 stock combinations shown separately. 3 stocks are graphed together in tab E.) 1. Label the three points on the graph that represent 100% investment in each stock. (Label with the ticker symbol of the stock for example ENB, CNR, TD) 2. Circle and label the minimum risk portfolio and write the % invested in each stock next to the point. (Hint: Move cursor over a point on graph and compare labels to TAB C data.) 3.a. Which stocks provide the greatest diversification benefits? Why? b. Put a square around your optimal portfolio and identify the E(R) and standard deviation for this portfolio. Label your answer. (Note: There is more than one correct answer.) 4. Based on this historical information which stocks would you choose for a portfolio? Why? 5. Assume you require a monthly return greater than 1.1% on $10,000, and can only choose one of the portfolios out of the portfolios graphed. What portfolio most closely meets this and how much money ($10,000 must be invested) would you put in each stock? Circle this portfolio and write MRP for 1.1% next to it. Step 2: Gather the most recent 61 monthly stock prices for three common stocks from http://finance.yahoo.com/.(11/30/2015-01/03/2021) a. Go to yahoo.com and enter a ticker symbol for a stock in your QuesTrade portfolio in the Get Quotes area of Yahoo! Finance. b. Click on Chart to view a graph of historical stock prices. If a company does not have 5 years of data, choose another one. A.Instructions B.Input Series C.Portfolio Weights EF graphs E.EF graph EF data + Screenshot B E F G H K L M N O P What portfolio most closely meets this and how much money ($10,000 must be invested) would you put in each stock? Circle this portfolio and write MRP for 1.1% next to it. Step 2: Gather the most recent 61 monthly stock prices for three common stocks from http://finance.yahoo.com/. (11/30/2015-01/03/2021) a. Go to yahoo.com and enter a ticker symbol for a stock in your QuesTrade portfolio in the Get Quotes area of Yahoo! Finance. b. Click on Chart to view a graph of historical stock prices. If a company does not have 5 years of data, choose another one. c. At the bottom of the chart, click on Historical Prices d. Make the start date 11/30/2015 and change to monthly data then click Get Historical Data to get 61 months of data. (You need 61 observations to calculate 60 returns.) e. Click on Download to save the data. f. Repeat steps 2.a-f for two more stocks. Note: You will have to invert the dates in the data you downloaded from Yahoo Finance to match the set up in tab B. Make sure the dates match or try adjusting the dates in yahoo Finance and try again. g. Copy (DO NOT Cut & Paste) the adjusted close prices from the 3 stocks into the highlighted areas of B.Input Series tab below. Notice how the expected returns, standard deviations, covariances and correlations are calculated by looking at the formulas. h. Make a print out of the tab E graph and label your optimal investment in two of the three stocks. i. Label the three points on the graph that represent 100% investment in each stock, identifying each stock with both the stock ticker and A, B, or C j. Print and label tab C.Portfolio Weights Step 3: Replace the stock you did not choose in Step 2 with another stock under consideration in your QuesTrade portfolio. a. Go to Yahoo.com and gather monthly adjusted close prices for your new stock and replace one stock in the B.Input Series tab below. b. Make a print out of the tab E graph and label your optimal investment in two of the three stocks, identifying each stock with both the stock ticker and c. Label the three points on the graph that represent 100% investment in each stock, identifying each point with both the stock ticker and A, B, or C d. Print and label tab C.Portfolio Weights Step 4: Staple the graphs from the previous steps in order to this instruction sheet and turn in one set per team next class period. 1) Do you think this exercise would be useful for a first time investor who is trying to decide on two stocks to invest? Why or Why Not? 2) Do you think this exercise would be a useful strategy for an investor trying to pick an optimal portfolio of 30 stocks? Why or Why Not? A.Instructions B.Input Series C.Portfolio Weights EF graphs E.EF graph EF data + Screenshot B . K L M Z O P A E F Lab Exercise: Markowitz 3 Asset Portfolio Efficient Frontier Students are encouraged to work in teams. A different team member should gather the data for steps 2-4. Make sure you put each student's name in the file name and/or at the bottom of this tab. As an alternative to printing each step, you can copy the worksheet tabs, creating duplicate tabs. Label these tabs for the relevant part of the assignment, Step 2H, etc. This exercise is designed to illustrate the creation of Efficient Frontiers using various weights for 2 or 3 asset portfolios. After completing the exercise students should have a better understanding of how Efficient Frontiers are created in practice and theory. Students should be able to explain the role correlation plays in creating a minimum risk portfolio. Download the "Markowitz 3 Asset Portfolio EF" file from Moodle SAVE and OPEN file in Excel. Step 1 Print the graph for combinations of 3 stocks: Enbridge, Canadian National Railway, and TD Bank by clicking on tab E below & printing. Answer the following questions related to the printout. You should also click on tabs B and C below to see how the inputs for the Efficient Frontier graphs were calculated. The objective of step 1 is to understand how the spreadsheet works. Label and answer the following questions on the printout of the overlapping 3 EF sets (Tab E graph below). (You may first wish to examine Tab D, 2 stock combinations shown separately. 3 stocks are graphed together in tab E.) 1. Label the three points on the graph that represent 100% investment in each stock. (Label with the ticker symbol of the stock for example ENB, CNR, TD) 2. Circle and label the minimum risk portfolio and write the % invested in each stock next to the point. (Hint: Move cursor over a point on graph and compare labels to TAB C data.) 3.a. Which stocks provide the greatest diversification benefits? Why? b. Put a square around your optimal portfolio and identify the E(R) and standard deviation for this portfolio. Label your answer. (Note: There is more than one correct answer.) 4. Based on this historical information which stocks would you choose for a portfolio? Why? 5. Assume you require a monthly return greater than 1.1% on $10,000, and can only choose one of the portfolios out of the portfolios graphed. What portfolio most closely meets this and how much money ($10,000 must be invested) would you put in each stock? Circle this portfolio and write MRP for 1.1% next to it. Step 2: Gather the most recent 61 monthly stock prices for three common stocks from http://finance.yahoo.com/.(11/30/2015-01/03/2021) a. Go to yahoo.com and enter a ticker symbol for a stock in your QuesTrade portfolio in the Get Quotes area of Yahoo! Finance. b. Click on Chart to view a graph of historical stock prices. If a company does not have 5 years of data, choose another one. A.Instructions B.Input Series C.Portfolio Weights EF graphs E.EF graph EF data + Screenshot B E F G H K L M N O P What portfolio most closely meets this and how much money ($10,000 must be invested) would you put in each stock? Circle this portfolio and write MRP for 1.1% next to it. Step 2: Gather the most recent 61 monthly stock prices for three common stocks from http://finance.yahoo.com/. (11/30/2015-01/03/2021) a. Go to yahoo.com and enter a ticker symbol for a stock in your QuesTrade portfolio in the Get Quotes area of Yahoo! Finance. b. Click on Chart to view a graph of historical stock prices. If a company does not have 5 years of data, choose another one. c. At the bottom of the chart, click on Historical Prices d. Make the start date 11/30/2015 and change to monthly data then click Get Historical Data to get 61 months of data. (You need 61 observations to calculate 60 returns.) e. Click on Download to save the data. f. Repeat steps 2.a-f for two more stocks. Note: You will have to invert the dates in the data you downloaded from Yahoo Finance to match the set up in tab B. Make sure the dates match or try adjusting the dates in yahoo Finance and try again. g. Copy (DO NOT Cut & Paste) the adjusted close prices from the 3 stocks into the highlighted areas of B.Input Series tab below. Notice how the expected returns, standard deviations, covariances and correlations are calculated by looking at the formulas. h. Make a print out of the tab E graph and label your optimal investment in two of the three stocks. i. Label the three points on the graph that represent 100% investment in each stock, identifying each stock with both the stock ticker and A, B, or C j. Print and label tab C.Portfolio Weights Step 3: Replace the stock you did not choose in Step 2 with another stock under consideration in your QuesTrade portfolio. a. Go to Yahoo.com and gather monthly adjusted close prices for your new stock and replace one stock in the B.Input Series tab below. b. Make a print out of the tab E graph and label your optimal investment in two of the three stocks, identifying each stock with both the stock ticker and c. Label the three points on the graph that represent 100% investment in each stock, identifying each point with both the stock ticker and A, B, or C d. Print and label tab C.Portfolio Weights Step 4: Staple the graphs from the previous steps in order to this instruction sheet and turn in one set per team next class period. 1) Do you think this exercise would be useful for a first time investor who is trying to decide on two stocks to invest? Why or Why Not? 2) Do you think this exercise would be a useful strategy for an investor trying to pick an optimal portfolio of 30 stocks? Why or Why Not? A.Instructions B.Input Series C.Portfolio Weights EF graphs E.EF graph EF data + Screenshot
Step by Step Solution
There are 3 Steps involved in it

Get step-by-step solutions from verified subject matter experts