

Question: B LC 1 PC 29A Completing a comprehensive financial staiement analysis D E F G -830 190 165 155 3 In its annual report, ABC
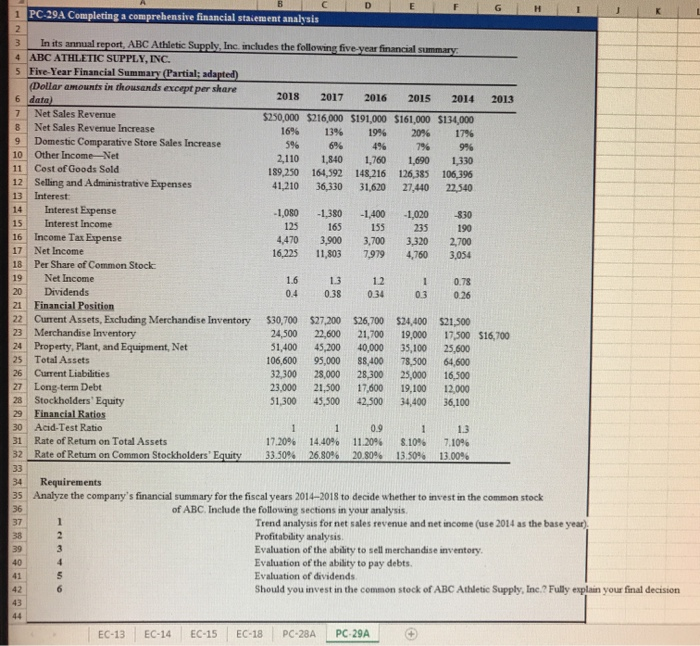
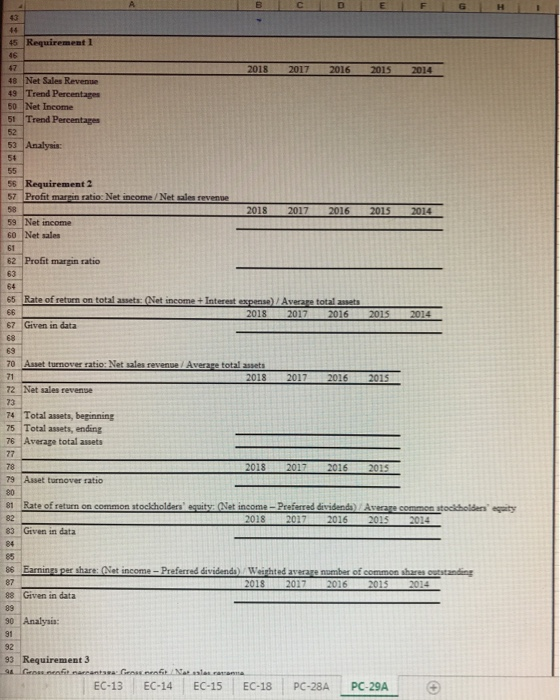
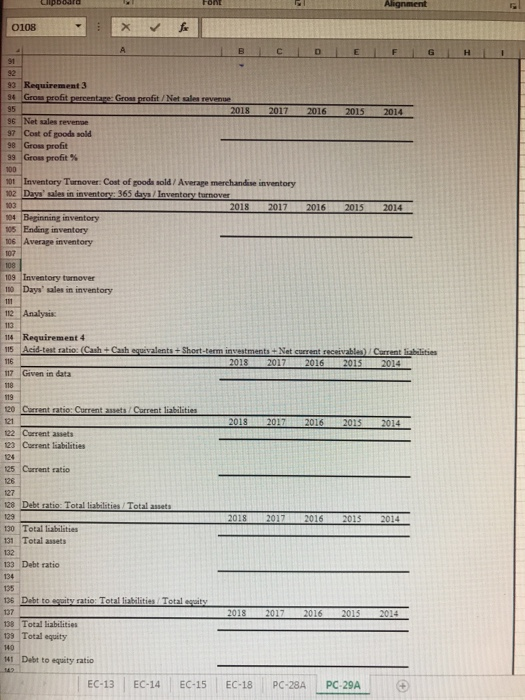
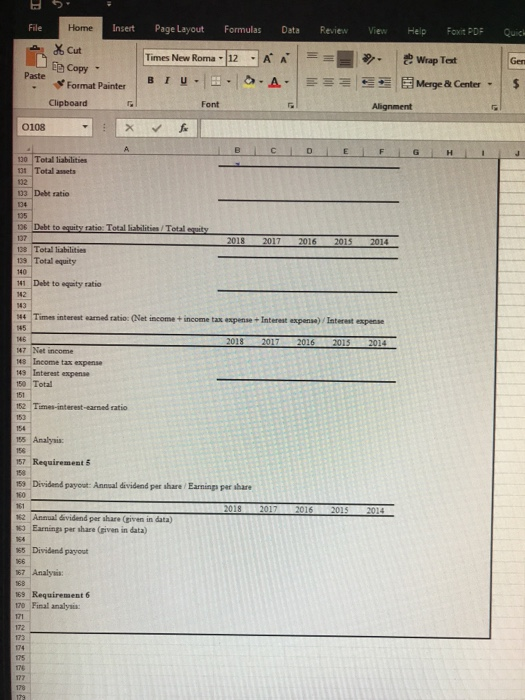
B LC 1 PC 29A Completing a comprehensive financial staiement analysis D E F G -830 190 165 155 3 In its annual report, ABC Athletic Supply, Inc. includes the following five-year financial summary 4 ABC ATHLETIC SUPPLY, INC. 5 Five-Year Financial Summary (Partial; adapted) (Dollar amounts in thousands except per share 6 data) 2018 2017 2016 2015 2014 2013 7 Net Sales Revenue $250,000 $216,000 $191,000 $161,000 $134,000 8 Net Sales Revenue Increase 16% 13% 19% 20% 17% 9 Domestic Comparative Store Sales Increase 5% 6% 4% 79% 99% 10 Other IncomeNet 2,110 1,840 1,760 1,690 1,330 11 Cost of Goods Sold 189,250 164,592 148,216 126,385 106,396 12 Selling and Administrative Expenses 41,210 36,33031,620 27,440 22,540 13 Interest: 14 Interest Expense -1,080 -1,380 -1,400 -1,020 15 Interest Income 125 235 16 Income Tax Expense 4,470 3,900 3,700 3,320 2,700 17 Net Income 16.225 11,803 7979 4,760 3,054 18 Per Share of Common Stock 19 Net Income 13 12 0.78 20 Dividends 0.38 0.34 0.3 0.26 21 Financial Position 22 Current Assets, Excluding Merchandise Inventory 530,700 527,200 $26,700 524,400 $21.500 23 Merchandise Inventory 24,500 22,600 21,700 19,000 17,500 $16,700 24 Property, Plant, and Equipment, Net 51,400 45,200 40,000 35,100 25,600 25 Total Assets 106,600 95,000 $8,400 78,500 64,600 26 Current Liabilities 32,300 28,000 28,300 25,000 16,500 27 Long-term Debt 23.000 21,500 17,600 19,100 12.000 28 Stockholders' Equity 51,300 45,500 42,500 34,400 36,100 29 Financial Ratios 30 Acid-Test Ratio 31 Rate of Return on Total Assets 17.20% 14.40% 11.20% 8.10% 7.10% 32 Rate of Retum on Common Stockholders' Equity 33.50% 26.80% 20.80% 13.50% 13.00% 34 35 Requirements Analyze the company's financial summary for the fiscal years 2014-2018 to decide whether to invest in the common stock of ABC Include the following sections in your analysis Trend analysis for net sales revenue and net income (use 2014 as the base year) Profitability analysis Evaluation of the ability to sell merchandise inventory. Evaluation of the ability to pay debts. Evaluation of dividends Should you invest in the common stock of ABC Athletic Supply, Inc.? Fully explain your final decision EC-13 EC-14 EC-15 EC-18 PC-28A PC-29A Requirement I 2018 2017 2016 2015 2014 48 Net Sales Revenue 49 Trend Percentage 50 Net Income 51 Trend Percentage 5) Analysis 56 Requirement 2 57 Profit marrin ratio Net income / Net sales revenu 2018 2017 2016 2015 2014 59 Net income 60 Net sales 62 Profit margin ratio 65 Rate of return on total assets (Net ineome+Interest expenso/Averare total assets 2018 2017 2016 67 Given in data 2015 2014 2017 2016 2015 70 Asset turnover ratio: Net sales revenue Average total assets 71 2018 72 Net sales revenge 73 74 Total assets, beginning 75 Total assets, ending 76 Average total assets 2018 2017 2016 2015 79 Asset turnover ratio 61 Rate of return on common stockholdersguity Net income - Preferred dividende Avere common stocche 82 2018 2017 2016 2015 2014 80 Given in data 86 Earni reper share: Net income-Preferred dividende) Weathtad avere number of common shares cuando 87 2018 2017 2016 2015 2014 88 Given in data 30 Analysis 92 99 Requirement 3 C ant Genc Nasa EC-13 EC-14 EC-15 EC-18 PC-28A PC-29A 0108 2016 2015 2014 93 Requirement 3 94 Grom profit percentare: Grow profit/Net ales revenue 2018 2017 96 Net sales revenge 97 Cost of goods sold 98 Gross profit 99 Grous profit % 100 101 Inventory Turnover: Cost of goods sold/Average merchandise inventory 102 Days' ales in inventory 365 days / Inventory turnover 103 2018 2017 104 Beginning inventory 105 Ending inventory 10 Average inventory 2016 2015 2014 109 Inventory turnover 10 Days' sales in inventory 112 Analysis 114 Requirement 4 115 Acid-test ratio(Cash 116 117 Given in data Cash equivalents + Short-term investments + Net current receivables 2018 2017 2016 2015 Current liabilities 2014 120 Current ratio: Current assets Current liabilities 2018 2017 2016 2015 2014 122 Current a s 23 Current abilities 25 Current ratio 128 Debt ratio: Total liabilities/Total arts 2018 2017 2016 2015 2014 130 Totallaties 131 Total assets 132 133 Debt ratio 05 136 Debt to county ratio: Total liabilities/Total cruity 2018 2017 2016 138 139 Total liabilities Total equity Debt to eat ratio EC-13 EC-14 EC-15 EC-18 PC-28A PC-29A File Home Insert Page Layout Formulas Data Review View Help Fort PDF Quy X Cut Fe Copy Format Painter Times New Roma - 12 BIU. . AM . A. Wrap Teat Merge Center - Paste Clipboard Font Alignment 0108 B C D E F G H I 10 Total liabilities 191 Total asets 03 Debt ratio 2018 2017 2016 2015 2014 196 Debt to cesty sati: Tetabilities/Total.cat 137 138 Total liabilities 139 Total equity 140 11 Debt to equity ratio ** Times interest and tieNet income income tax expense Interest exper) / Interest expens 2018 2017 2016 2015 2014 147 Net income 19 Income tax expense 149 Internet expense 150 Total Time interest-earned to 185 Analysis 157 Requirements 159 Dividend payout: Annual dividend per share Earning per har 2017 2016 2015 2016 11 12 Annual dividend per share (given in data) 160 Earnings per share (given in data) Dividend payout 17 Analysis 19 Requirement 6 170 Final analysis
Step by Step Solution
There are 3 Steps involved in it

Get step-by-step solutions from verified subject matter experts