

Question: (b) Locate the sample mean asd stancard devation for our vartable, (Round your answers to four decimal places.) The random variable value that is predected
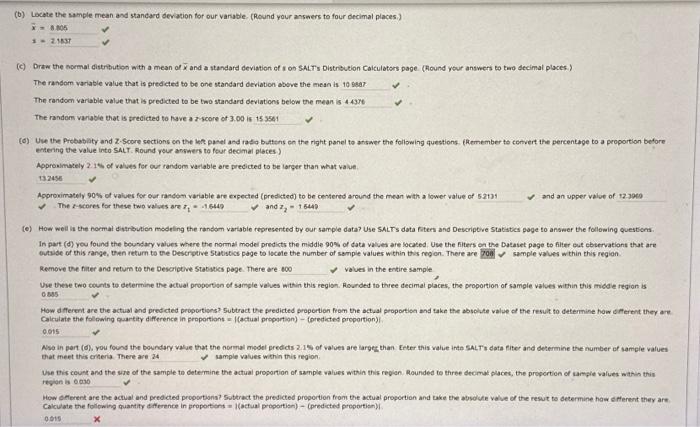
(b) Locate the sample mean asd stancard devation for our vartable, (Round your answers to four decimal places.) The random variable value that is predected to be one standard deviation above the mean is The random variable value that is predicted to be two standard deviations below the mean is The random variable that is tredicted to fuve a z-score of 3.00 is enterng the value into SALT. Round rour anhiners to four decimal ploces) Approaimately 2 is of walues fer our random varlable are predicted to be larger than what value. Approvimately 90% of values for eor random variable are expected (predicted) to be centered around the mean with a lower value of and an upper value of 12.390 The z-scores for thase two values are : and z2= Remove the fiter and retum to the Descriche Stabsacs page. There are values in the entire sample. Calcuiate the folowing partify difference in proportions = I(actual proportion) - (predicted proportion) Ehat ineet this criteria. There are sample values within this region. revion is Calculate the folfowing quantify diference in proportions = l(actual proportisn) - (predicted preportisn))
Step by Step Solution
There are 3 Steps involved in it

Get step-by-step solutions from verified subject matter experts