

Question: B om A Part A 25 Points Problem Set - Fill in each of the missing cells for all the firms listed below. G E
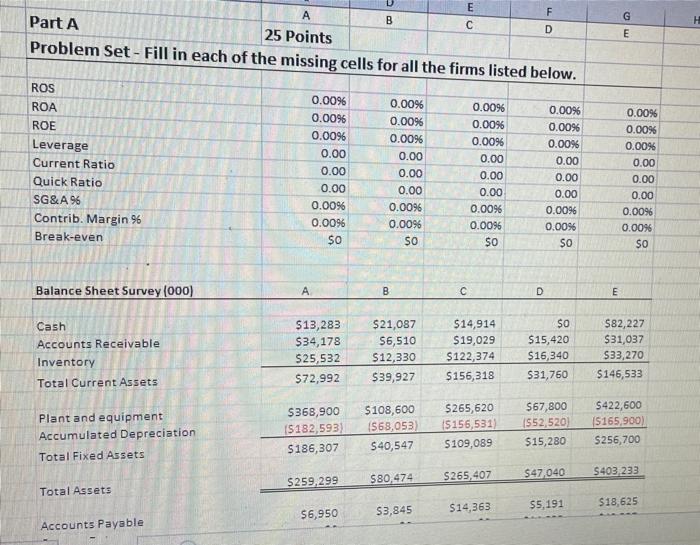
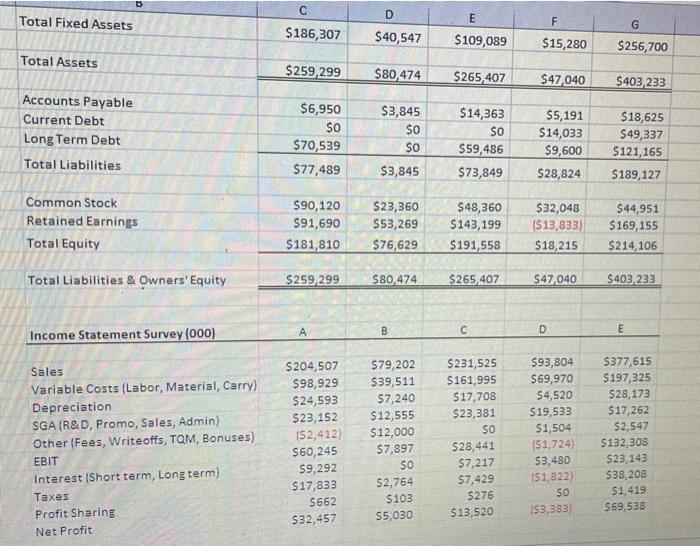
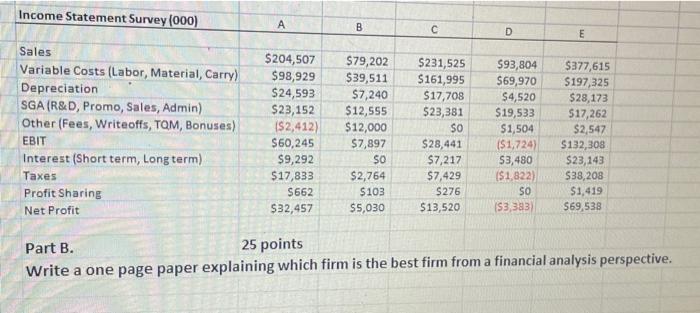
B om A Part A 25 Points Problem Set - Fill in each of the missing cells for all the firms listed below. G E ROS ROA ROE Leverage Current Ratio Quick Ratio SG & A 96 Contrib. Margin 96 Break-even 0.0096 0.0096 0.009 0.00 0.00 0.00 0.00% 0.0096 $0 0.00% 0.0096 0.0096 0.00 0.00 0.00 0.0096 0.0096 SO 0.00% 0.0096 0.0096 0.00 0.00 0.00 0.0096 0.0096 0.00% 0.0096 0.00% 0.00 0.00 0.00 0.0096 0.0096 SO 0.00% 0.00% 0.00% 0.00 0.00 0.00 0.00% 0.00% SO 50 Balance Sheet Survey (000) A B D E Cash Accounts Receivable Inventory Total Current Assets $13,283 $34,178 $25,532 $72,992 $21,087 56,510 $12,330 $39,927 $14,914 $19,029 $122,374 $156,318 SO $15,420 $16,340 $31,760 $82,227 $31,037 $33,270 $146,533 Plant and equipment Accumulated Depreciation Total Fixed Assets $368,900 15182,593) S186,307 $108,600 1568,053) $40,547 $265,620 15156,531) $109,089 $67,800 1552,520 $15,280 S422,600 15165,900) S256,700 $259,299 $80,474 $265,407 $47,040 S403, 233 Total Assets 55.191 $18,625 $14,363 56,950 S3,845 Accounts Payable D Total Fixed Assets F G $186,307 $40,547 E $109,089 $15,280 $256,700 Total Assets $259,299 $80,474 $265,407 $47,040 $403 233 Accounts Payable Current Debt Long Term Debt Total Liabilities $6,950 $o $70,539 $77,489 $3,845 $o $0 $3,845 $14,363 SO $59,486 $73,849 $5,191 $14,033 $9,600 $28,824 $18,625 $49,337 $121,165 $189,127 Common Stock Retained Earnings Total Equity $90,120 $91,690 $181,810 $23,360 $53,269 $76,629 $48,360 $143,199 $191,558 $32,048 ($13,833) $18,215 $44,951 $169,155 $214,106 Total Liabilities & Owners' Equity $259,299 $80,474 $265,407 S47,040 $403,233 A B D E Income Statement Survey (000) Sales Variable Costs (Labor, Material, Carry) Depreciation SGA (R&D, Promo, Sales, Admin) Other (Fees, Writeoffs, TOM, Bonuses) EBIT Interest (Short term, Long term) Taxes Profit Sharing Net Profit $204,507 $98,929 $24,593 $23,152 (S2,412) $60,245 $9,292 $17,833 S662 532,457 579,202 $39,511 57,240 $12,555 $12,000 57,897 SO $2,764 S103 $5,030 $231,525 $161,995 $17,708 $23,381 SO $28,441 $7,217 $7,429 $276 $13,520 $93,804 $69,970 54,520 $19,533 $1,504 151,724 $3,480 $1,822) $377,615 $197,325 $28,173 $17,262 $2,547 $132,308 $23,143 $38,208 $1,419 $69,538 SO 153,383 Income Statement Survey (000) B D E Sales Variable Costs (Labor, Material, Carry) Depreciation SGA (R&D, Promo, Sales, Admin) Other (Fees, Writeoffs, TOM, Bonuses) EBIT Interest (Short term, Long term) Taxes Profit Sharing Net Profit $ 204,507 $98,929 $24,593 $23,152 IS2,412) $60,245 $9,292 $17,833 $662 $32,457 $79,202 $39,511 $7,240 $12,555 $12,000 $7,897 SO $2,764 S103 $5,030 $231,525 $161,995 $17,708 $23,381 SO $28,441 $7,217 $7,429 $276 $13,520 $93,804 $69,970 $4,520 $19,533 $1,504 (51,724 $3,480 ($1.822) SO S3,383 $377,615 $197,325 $28,173 517,262 $2,547 $132,308 $23,143 $38,208 $1,419 $69,538 Part B. 25 points Write a one page paper explaining which firm is the best firm from a financial analysis perspective
Step by Step Solution
There are 3 Steps involved in it

Get step-by-step solutions from verified subject matter experts