

Question: b. Plot the zero-coupon yield curve (for the first five years). (Select the best choice below.) O A. O B. YIELD CURVE YIELD CURVE 7-
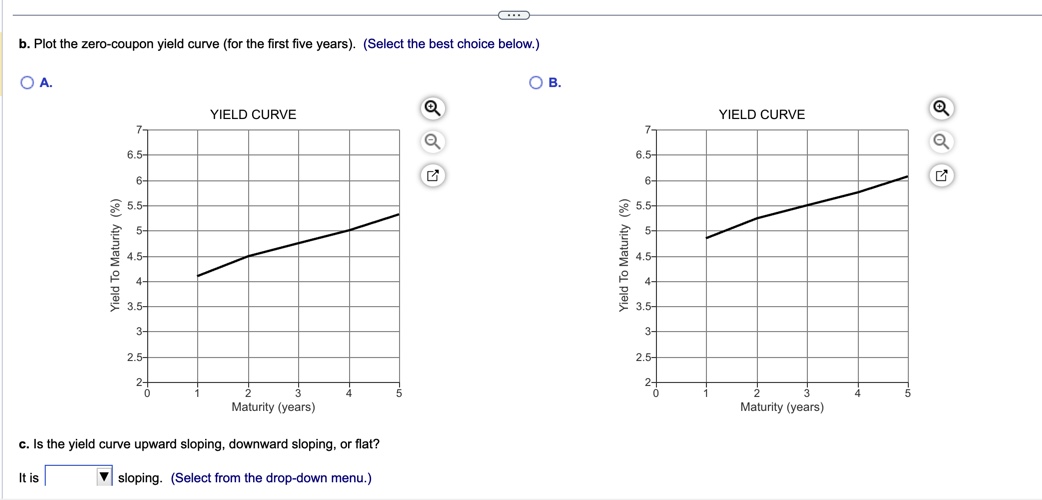
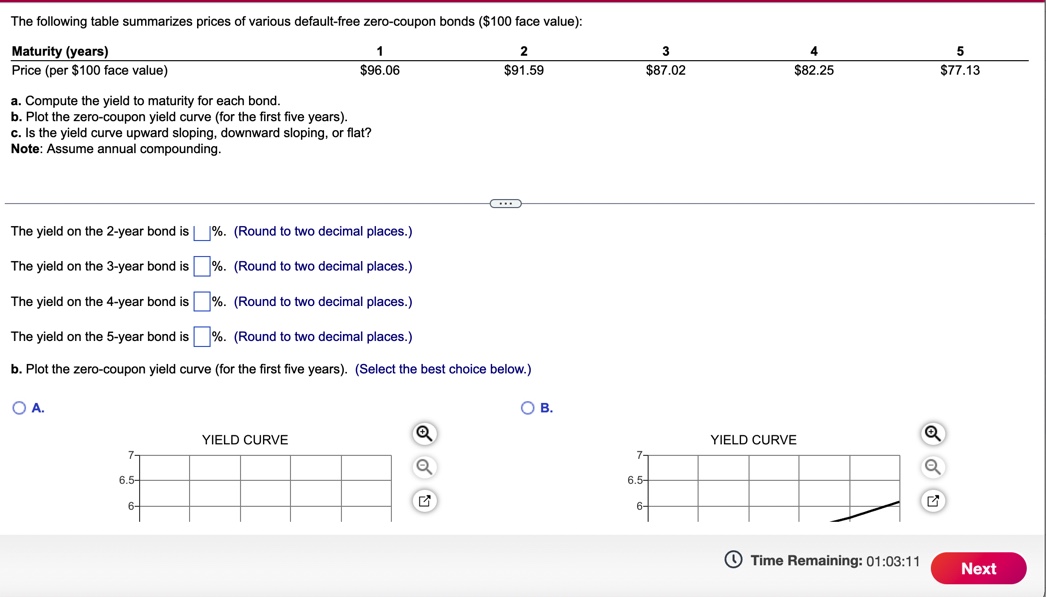
b. Plot the zero-coupon yield curve (for the first five years). (Select the best choice below.) O A. O B. YIELD CURVE YIELD CURVE 7- 7- 6.5- 6,5- 6- 5.5- 5.5- 5- Yield To Maturity (%) 4.5- Yield To Maturity (%) in 3.5- 3.5- 3. 3- 2.5- 2.5- 2- Maturity (years) Maturity (years) c. Is the yield curve upward sloping, downward sloping, or flat? It is sloping. (Select from the drop-down menu.)The following table summarizes prices of various default-free zero-coupon bonds ($100 face value): Maturity (years) 1 2 3 5 Price (per $100 face value) $96.06 $91.59 $87.02 $82.25 $77.13 a. Compute the yield to maturity for each bond. b. Plot the zero-coupon yield curve (for the first five years). c. Is the yield curve upward sloping, downward sloping, or flat? Note: Assume annual compounding. The yield on the 2-year bond is | %. (Round to two decimal places.) The yield on the 3-year bond is %. (Round to two decimal places.) The yield on the 4-year bond is %. (Round to two decimal places.) The yield on the 5-year bond is %. (Round to two decimal places.) b. Plot the zero-coupon yield curve (for the first five years). (Select the best choice below.) O A. O B. YIELD CURVE YIELD CURVE 7- 7 6.5- 6.5- 6- Time Remaining: 01:03:11 Next
Step by Step Solution
There are 3 Steps involved in it

Get step-by-step solutions from verified subject matter experts