

Question: (b) Press the Generate Samples button below to simulate taking 19 more samples of size n = 15 from the population. Notice that the

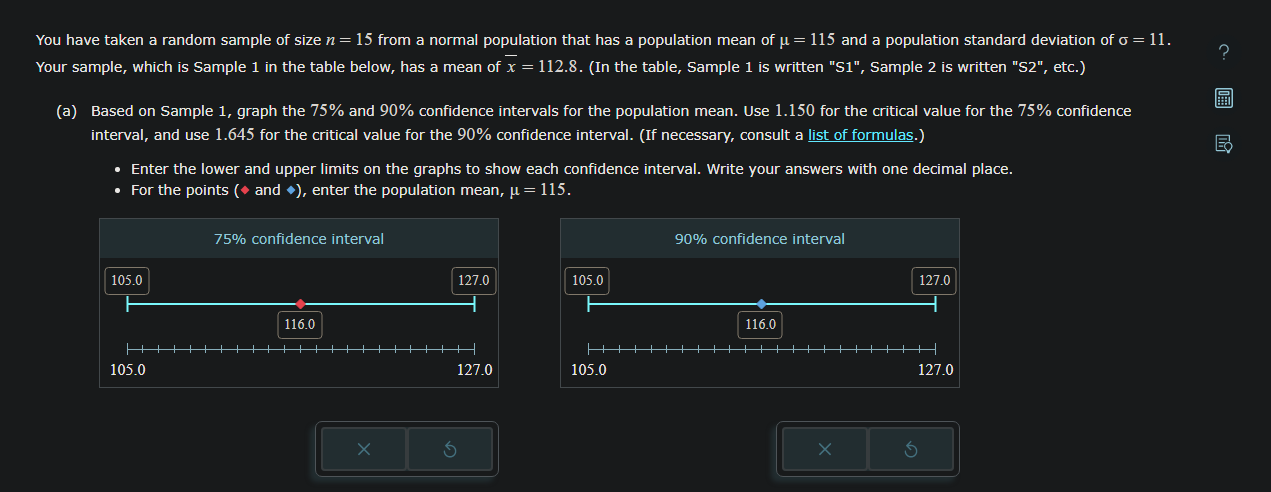
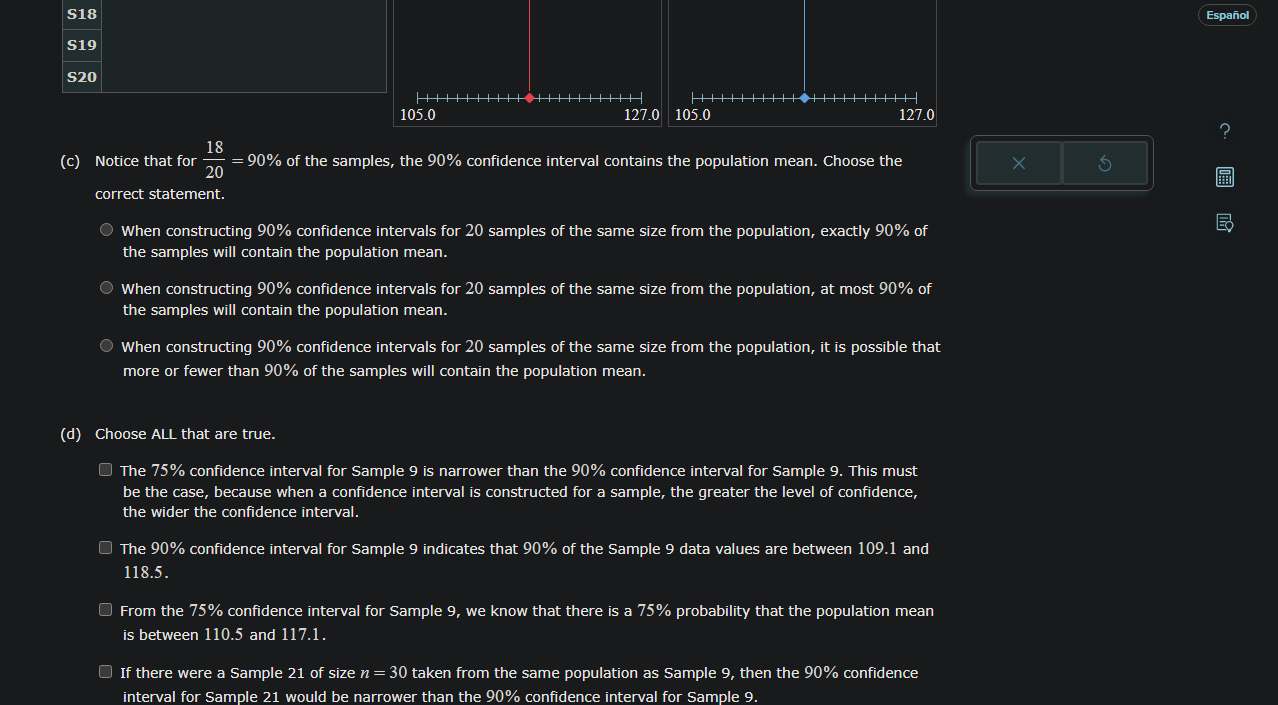
(b) Press the "Generate Samples" button below to simulate taking 19 more samples of size n = 15 from the population. Notice that the confidence intervals for these samples are drawn automatically. Then complete parts (c) and (d) below the table. x 75% 75% 90% 90% lower upper lower upper S1 112.8 limit limit limit limit ? ? ? 75% confidence intervals ? S2 S3 S4 Generate Samples S5 S6 S7 S8 S9 S10 S11 S12 S13 S14 S15 S16 S17 90% confidence intervals ? B You have taken a random sample of size n = 15 from a normal population that has a population mean of = 115 and a population standard deviation of = 11. Your sample, which is Sample 1 in the table below, has a mean of x = 112.8. (In the table, Sample 1 is written "S1", Sample 2 is written "S2", etc.) (a) Based on Sample 1, graph the 75% and 90% confidence intervals for the population mean. Use 1.150 for the critical value for the 75% confidence interval, and use 1.645 for the critical value for the 90% confidence interval. (If necessary, consult a list of formulas.) Enter the lower and upper limits on the graphs to show each confidence interval. Write your answers with one decimal place. For the points ( and ), enter the population mean, = 115. 105.0 105.0 75% confidence interval 116.0 127.0 105.0 127.0 105.0 90% confidence interval 116.0 127.0 127.0 B S18 S19 S20 18 (c) Notice that for 20 105.0 127.0 105.0 = 90% of the samples, the 90% confidence interval contains the population mean. Choose the 127.0 correct statement. When constructing 90% confidence intervals for 20 samples of the same size from the population, exactly 90% of the samples will contain the population mean. When constructing 90% confidence intervals for 20 samples of the same size from the population, at most 90% of the samples will contain the population mean. When constructing 90% confidence intervals for 20 samples of the same size from the population, it is possible that more or fewer than 90% of the samples will contain the population mean. (d) Choose ALL that are true. The 75% confidence interval for Sample 9 is narrower than the 90% confidence interval for Sample 9. This must be the case, because when a confidence interval is constructed for a sample, the greater the level of confidence, the wider the confidence interval. The 90% confidence interval for Sample 9 indicates that 90% of the Sample 9 data values are between 109.1 and 118.5. From the 75% confidence interval for Sample 9, we know that there is a 75% probability that the population mean is between 110.5 and 117.1. If there were a Sample 21 of size n = 30 taken from the same population as Sample 9, then the 90% confidence interval for Sample 21 would be narrower than the 90% confidence interval for Sample 9. Espaol EX
Step by Step Solution
There are 3 Steps involved in it

Get step-by-step solutions from verified subject matter experts