

Question: b) Ruben plots the following (partial) interaction plot to his data in R : music N - 6 380 mean of time 370 2 snack
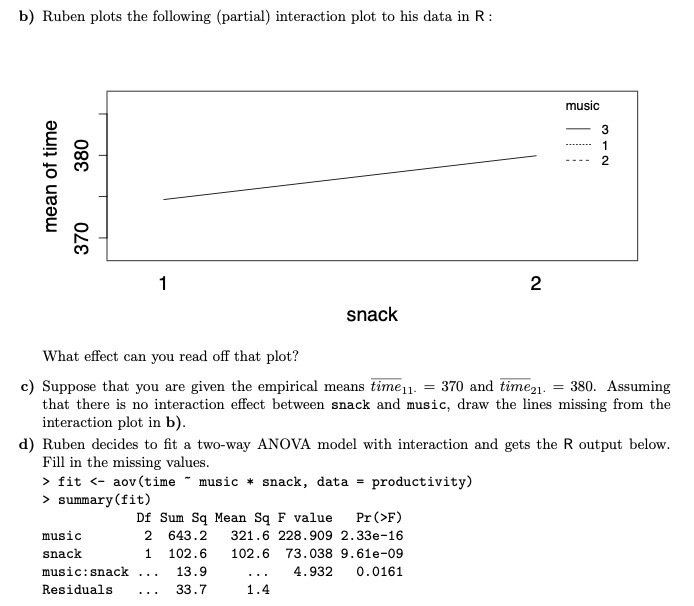
b) Ruben plots the following (partial) interaction plot to his data in R : music N - 6 380 mean of time 370 2 snack What effect can you read off that plot? c) Suppose that you are given the empirical means timen1. = 370 and time21. = 380. Assuming that there is no interaction effect between snack and music, draw the lines missing from the interaction plot in b). d) Ruben decides to fit a two-way ANOVA model with interaction and gets the R output below. Fill in the missing values. > fit summary (fit) Df Sum Sq Mean Sq F value Pr (>F) music 2 643.2 321.6 228. 909 2.33e-16 snack 1 102.6 102.6 73. 038 9. 61e-09 music : snack . . . 13.9 4.932 0. 0161 Residuals 33.7 1.4
Step by Step Solution
There are 3 Steps involved in it

Get step-by-step solutions from verified subject matter experts