

Question: (b) Sketch the graph of the function f(x) = x2 3x + 4 on the interval 2 s x s 6. Y y 25 20
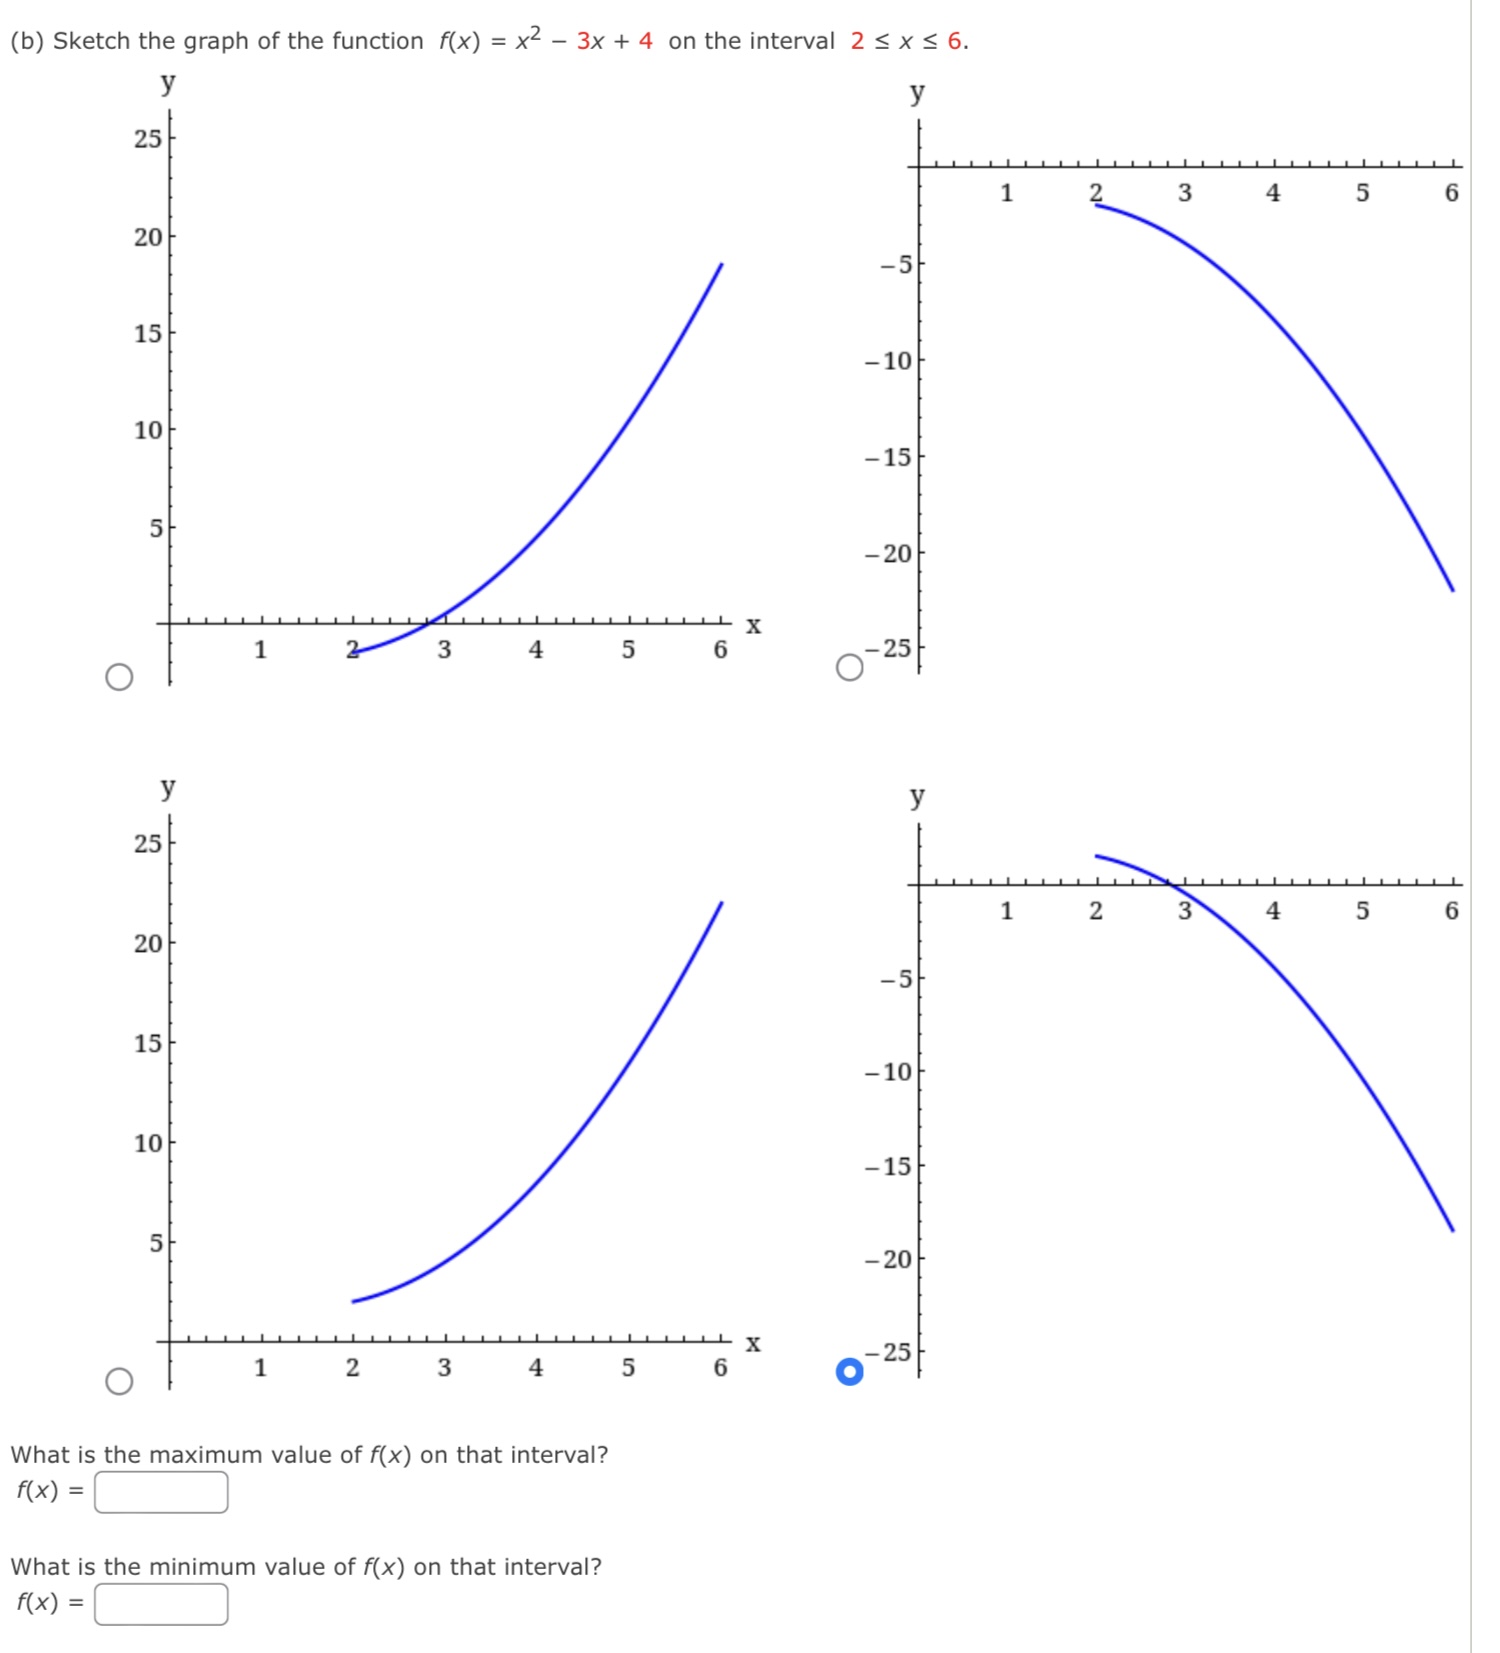
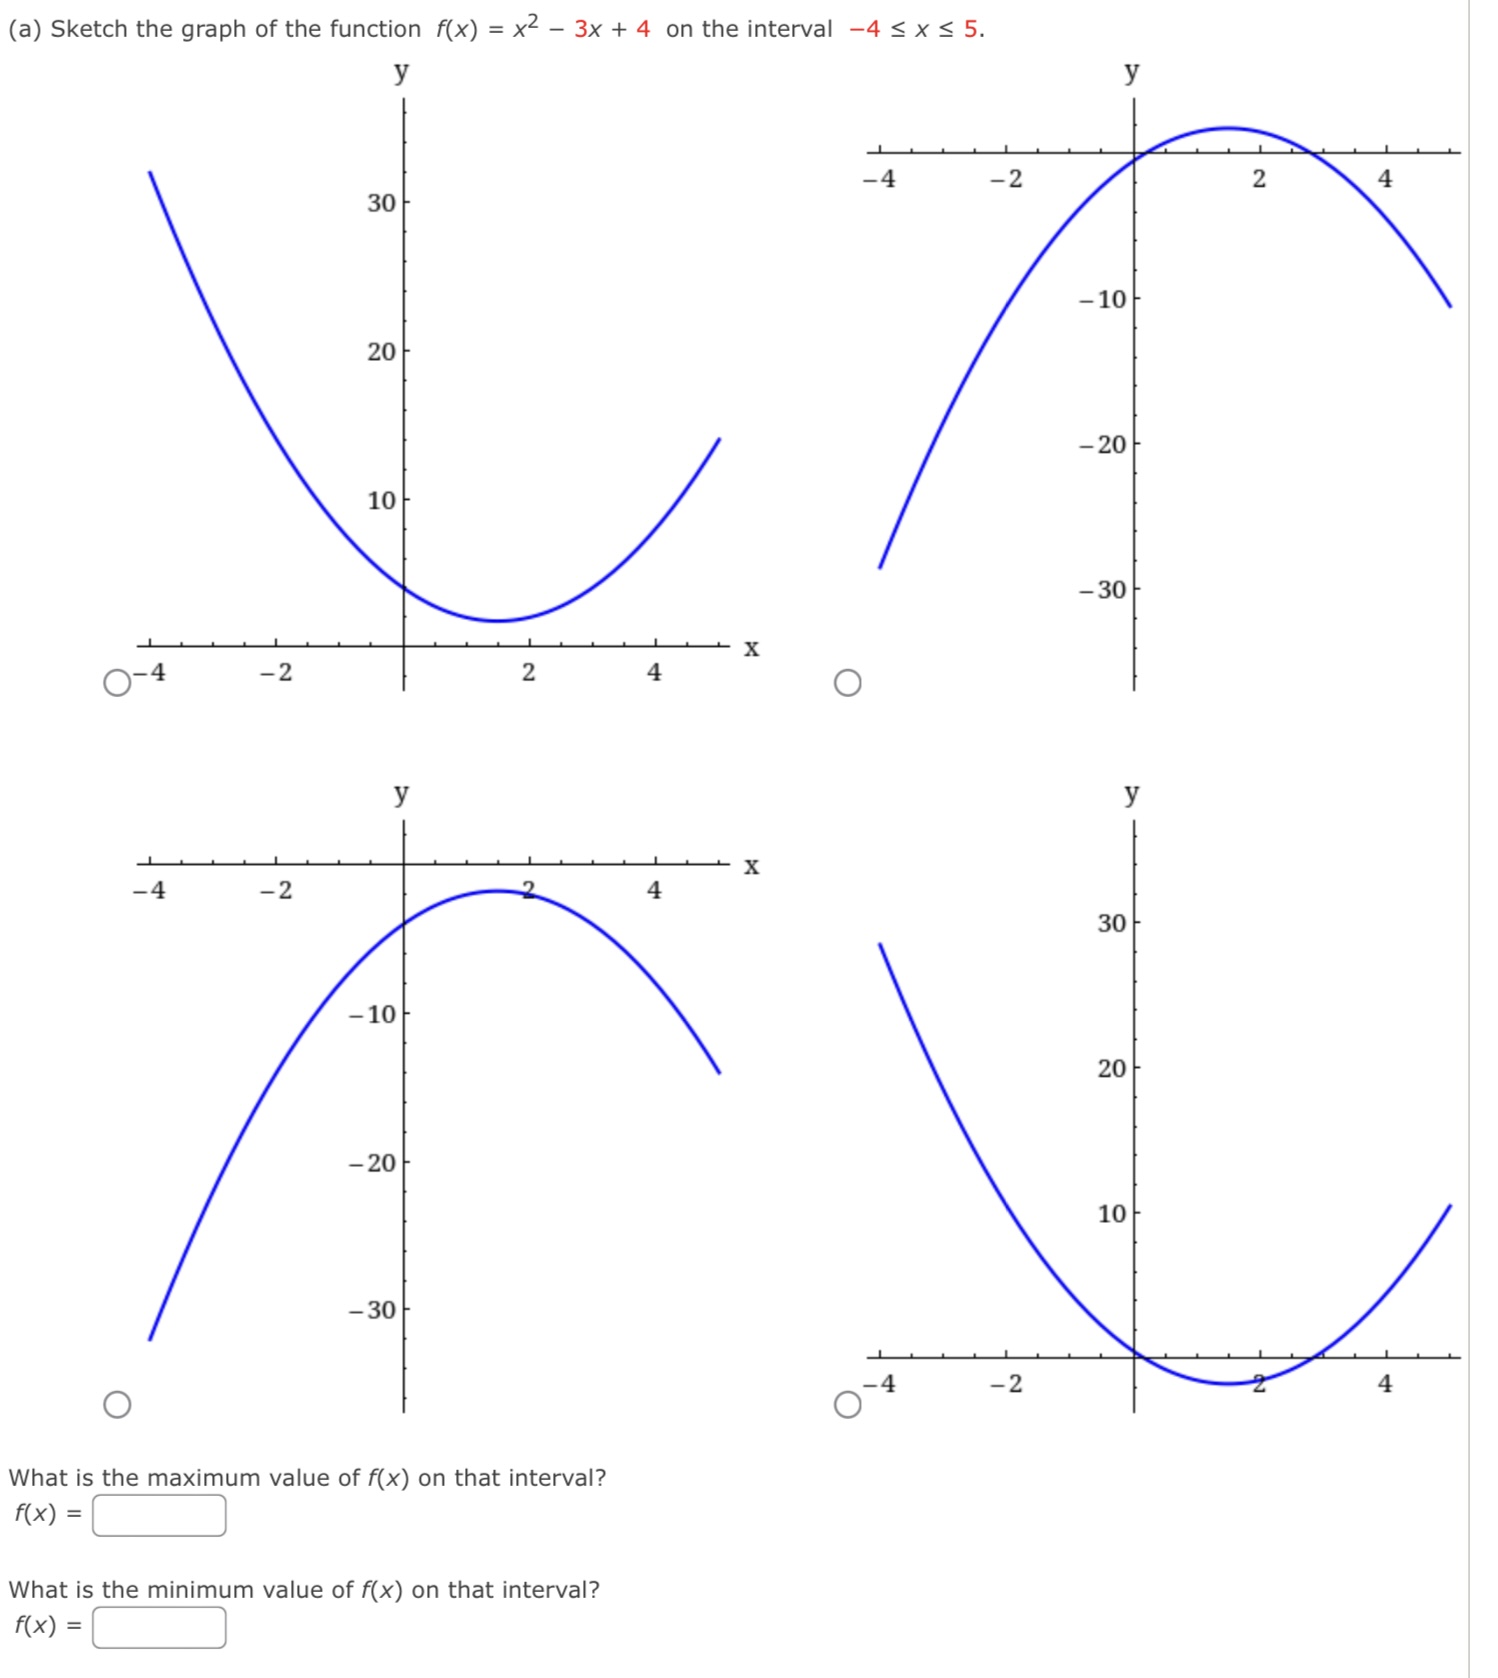


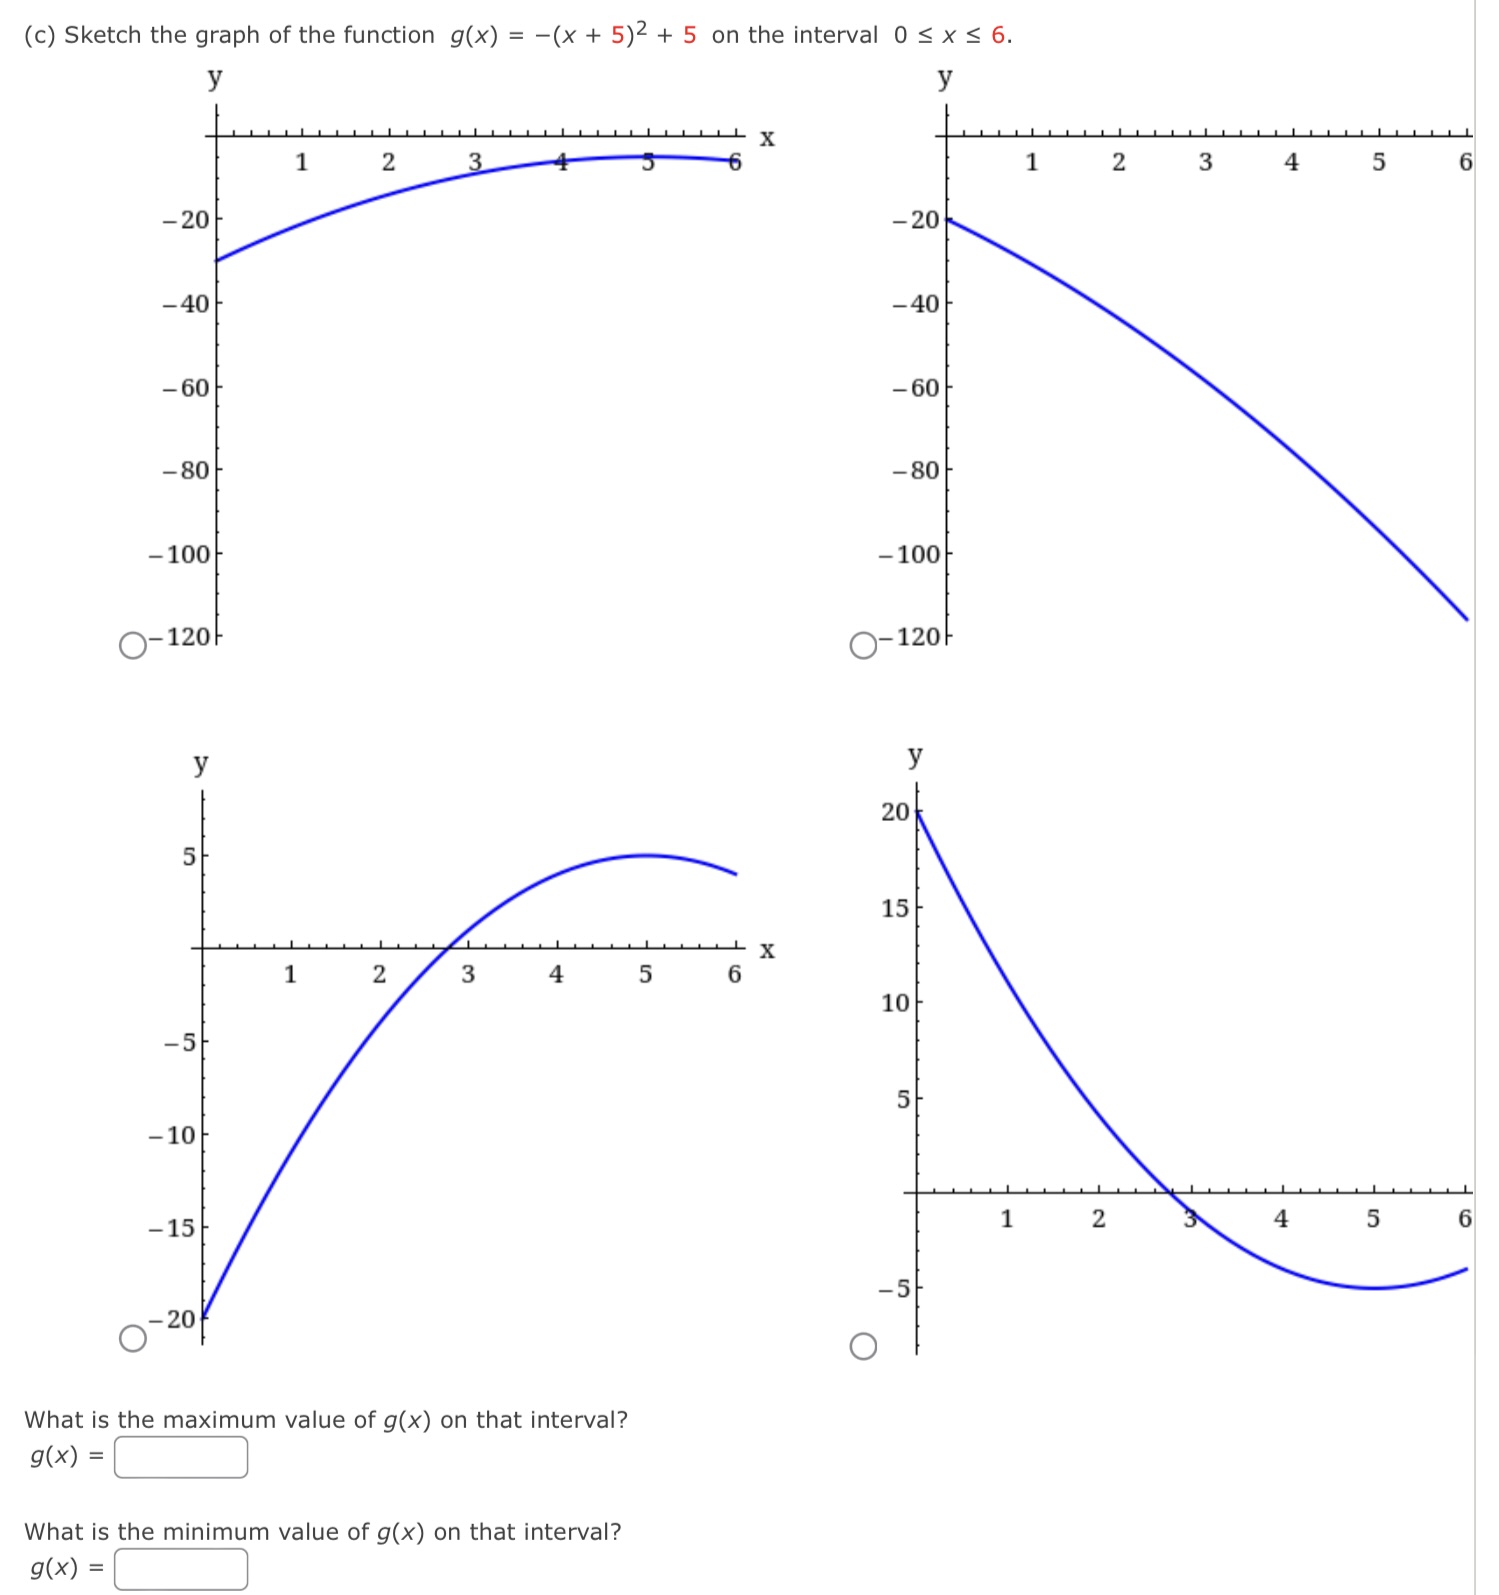
(b) Sketch the graph of the function f(x) = x2 3x + 4 on the interval 2 s x s 6. Y y 25 20 5 15 10 10 -15 5 20 -25 O Y Y 25 20 5 15 10 10 15 5 20 -25 O What is the maximum value of f(x) on that interval? rm = [:1 What is the minimum value of f(x) on that interval? rm = i: (a) Sketch the graph of the function f(x) = X2 3x + 4 on the interval 4 s x s S. Y Y 30 10 20 20 10 30 10 -20 -30 0 What is the maximum value of f(x) on that interval? rm = :1 What is the minimum value of f(x) on that interval? rm = :J (c) Sketch the graph of the function g(x) = (X + 5)2 + 5 on the interval 0 s x s 6. Y Y 20 40 50 80 -20 O What is the maximum value of g(x) on that interval? 900 = i: What is the minimum value of g(x) on that interval? m = {j
Step by Step Solution
There are 3 Steps involved in it

Get step-by-step solutions from verified subject matter experts