

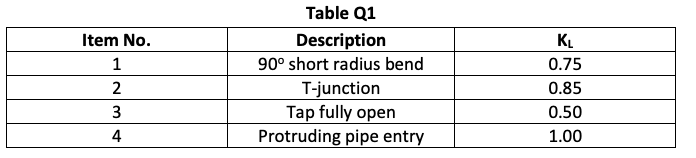
Question: ( b ) Sketch the typical flow paths in local pipe features 1 and 4 in Table Q 1 , and use your illustration to
b Sketch the typical flow paths in local pipe features and in Table Q and use your illustration to explain where, and how energy losses occur in both cases
Step by Step Solution
There are 3 Steps involved in it
1 Expert Approved Answer
Step: 1 Unlock

Question Has Been Solved by an Expert!
Get step-by-step solutions from verified subject matter experts
Step: 2 Unlock
Step: 3 Unlock