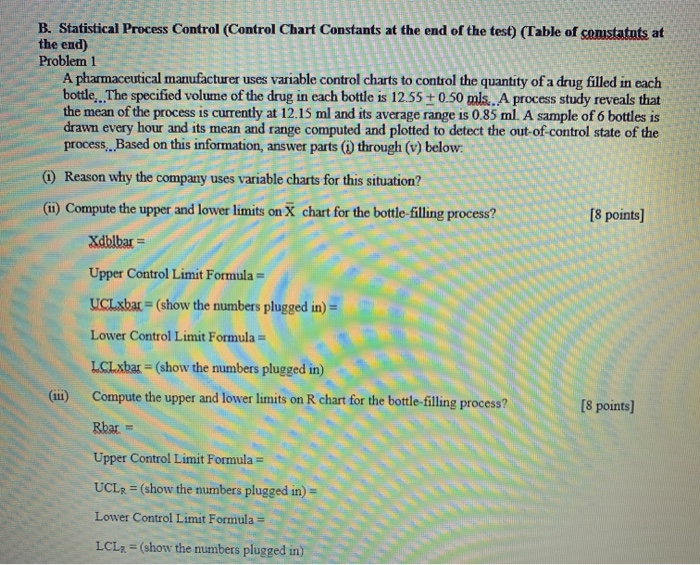
Question: B. Statistical Process Control (Control Chart Constants at the end of the test) (Table of constatats at the end) Problem 1 LLLLLL A pharmaceutical manufacturer

B. Statistical Process Control (Control Chart
B. Statistical Process Control (Control Chart Constants at the end of the test) (Table of constatats at the end) Problem 1 LLLLLL A pharmaceutical manufacturer uses variable control charts to control the quantity of a drug filled in each bottle. The specified volume of the drug in each bottle is 12.55 +0.50 mls.. A process study reveals that the mean of the process is currently at 12.15 ml and its average range is 0.85 ml. A sample of 6 bottles is drawn every hour and its mean and range computed and plotted to detect the out of control state of the process. Based on this information, answer parts (through (v) below: [8 points) 0 Reason why the company uses variable charts for this situation? (11) Compute the upper and lower limits on X chart for the bottle-filling process? Xdblbar = Upper Control Limit Formula UCLxbar = (show the numbers plugged in) = Lower Control Limit Formula = LCLxbar = (show the numbers plugged in) Compute the upper and lower limits on R chart for the bottle-filling proc [8 points) Upper Control Limit Formula UCLR = (show the numbers plugged in) = Lower Control Limit Formula = LCL2 = (show the numbers plugged in) (iv) Assume these limits are in place and process in control until the sample #20. Suppose the next two samples collected recorded the following quantities of the drug in the bottles.. Sample # 21: 12.05 12.30 12.70 12.05 11.95 12.55 Sample #22: 13.05 11.70 12.35 12.55 11.05 10.75 Calculate appropriate statistics for these two samples that will be needed to determine the state of control of the process. [10 points) MGT366/FINAL/W2020 3 of 7 (v) Based on sample no. 21 data, is the process in control? Why or why not? Indicate the action you will take (or not take) based on this sample. [5 points] (1 ) Based on sample no. 22 data, is the process in control? Why or why not? Indicate the action you will take (or not take) based on this sample. [5 points) Table for Control Chart Constants Sample A2D3 Size 3 1.023 0.000 4 0.729 0.000 5 0.577 0.000 6 0.483 0.000 0.419 | 0.076 8 0.373 0.136 9 0.337 | 0.184 10 0.308 0.223 D4 2.570 2.280 2.110 2.000 1.920 1.860 1.820 1.730 d2 1.693 2.059 2.326 2.534 2.704 2.847 2.970 3.078

Step by Step Solution

There are 3 Steps involved in it

1 Expert Approved Answer
Step: 1 Unlock blur-text-image
Question Has Been Solved by an Expert!

Get step-by-step solutions from verified subject matter experts

Step: 2 Unlock
Step: 3 Unlock

Students Have Also Explored These Related General Management Questions!