

Question: B). Take a look at the following data for two production shifts. Which shift is performing better? What changes if any would you recommend?(1+3 marks)
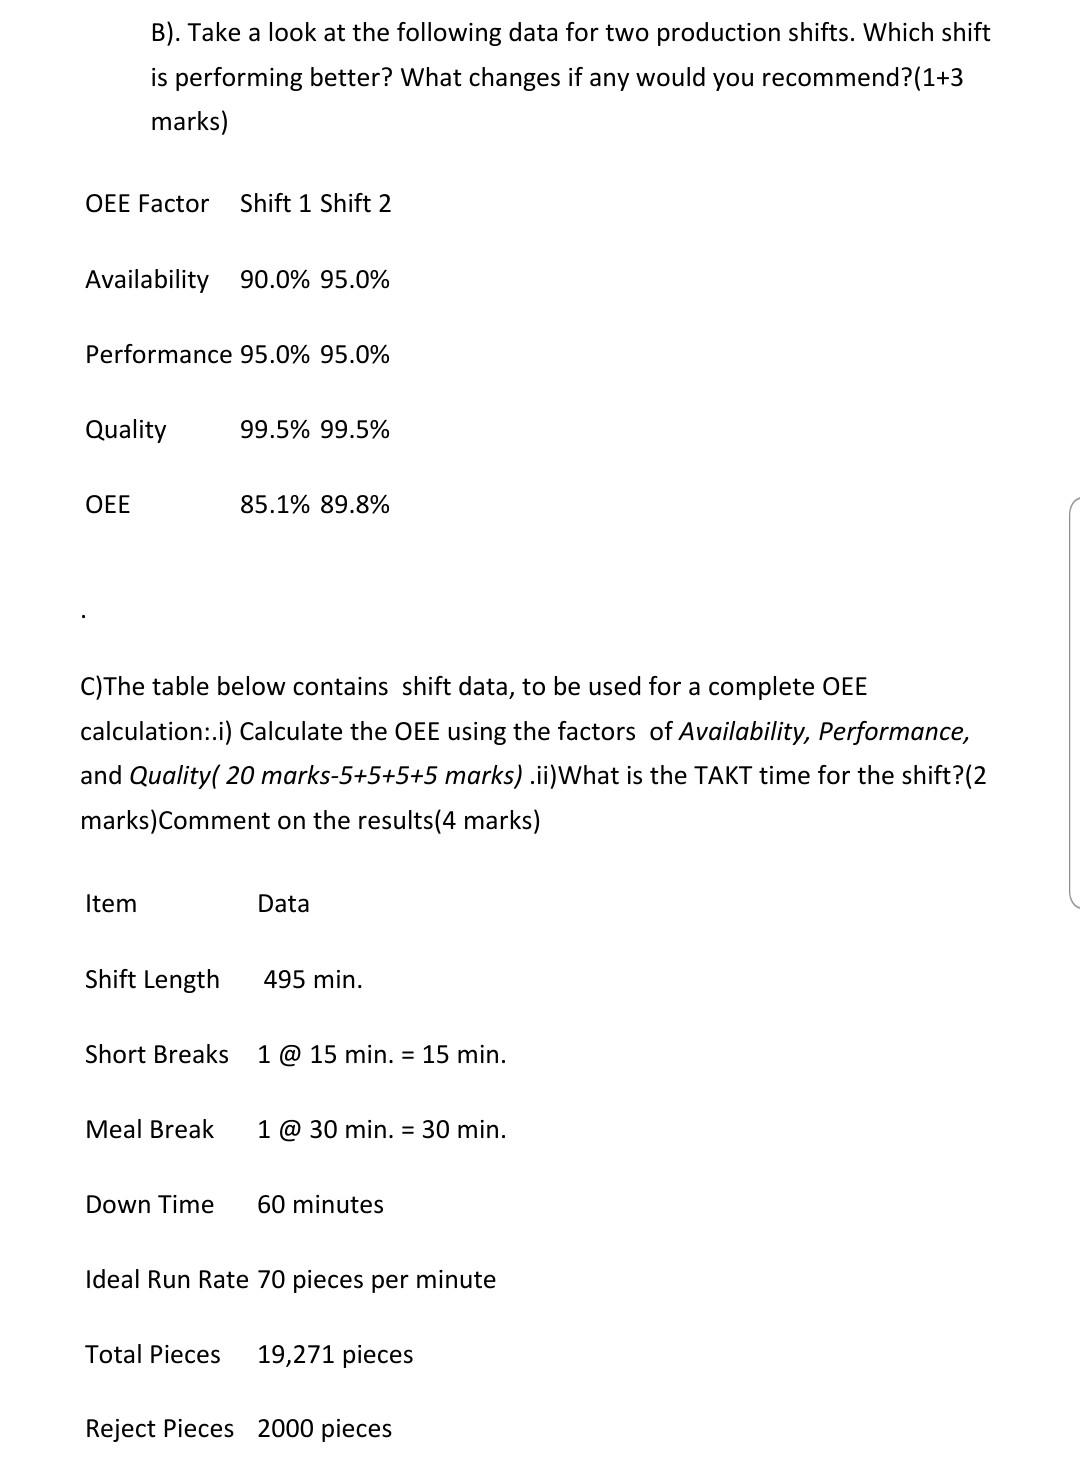
B). Take a look at the following data for two production shifts. Which shift is performing better? What changes if any would you recommend?(1+3 marks) OEE Factor Shift 1 Shift 2 Availability 90.0% 95.0% Performance 95.0% 95.0% Quality 99.5% 99.5% OEE 85.1% 89.8% C)The table below contains shift data, to be used for a complete OEE calculation:.i) Calculate the OEE using the factors of Availability, Performance, and Quality( 20 marks-5+5+5+5 marks) .ii)What is the TAKT time for the shift?(2 marks)Comment on the results(4 marks) Item Data Shift Length 495 min. Short Breaks 1 @ 15 min. = 15 min. Meal Break 1 @ 30 min. = 30 min. Down Time 60 minutes Ideal Run Rate 70 pieces per minute Total Pieces 19,271 pieces Reject Pieces 2000 pieces
Step by Step Solution
There are 3 Steps involved in it
1 Expert Approved Answer
Step: 1 Unlock

Question Has Been Solved by an Expert!
Get step-by-step solutions from verified subject matter experts
Step: 2 Unlock
Step: 3 Unlock