

Question: b . Test to see whether the coefficients you have estimated are statistically different from zero, using a 9 5 percent confidence level and a
Test to see whether the coefficients you have estimated are statistically different from zero, using a percent confidence level and a onetailed test.
c What percentage of the variation in sales is explained by this model?
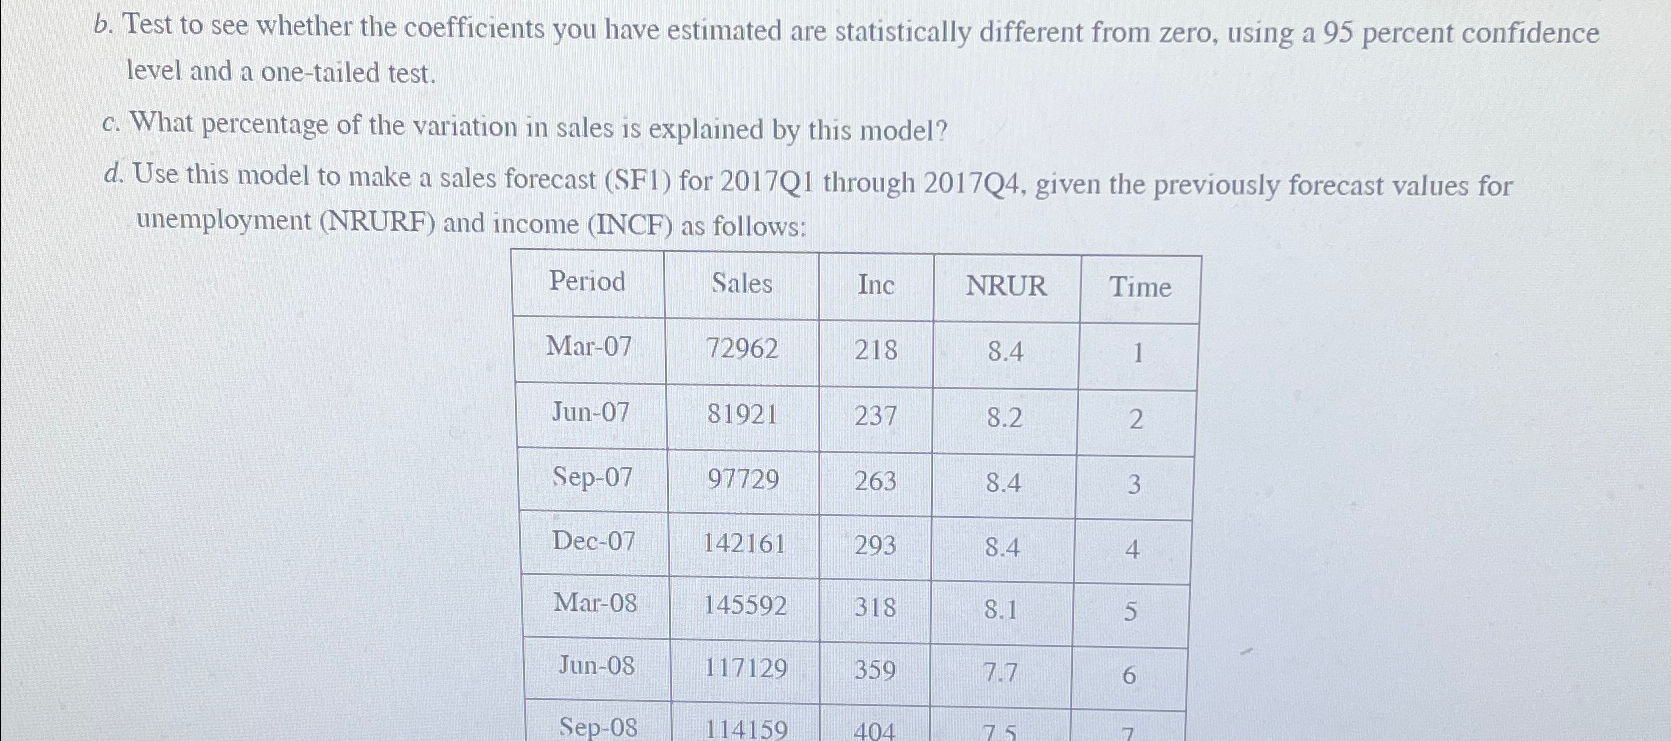
d Use this model to make a sales forecast SF for Q through Q given the previously forecast values for unemployment NRURF and income INCF as follows:
tablePeriodSales,Inc,NRUR,TimeMarJunSepDecMarJunSep
Step by Step Solution
There are 3 Steps involved in it
1 Expert Approved Answer
Step: 1 Unlock

Question Has Been Solved by an Expert!
Get step-by-step solutions from verified subject matter experts
Step: 2 Unlock
Step: 3 Unlock