

Question: B. The following histogram is representing marks obtained by 50 students of a class. 15- 12- 12 No. of students- 0 9.5 20.5 30.5 40.5
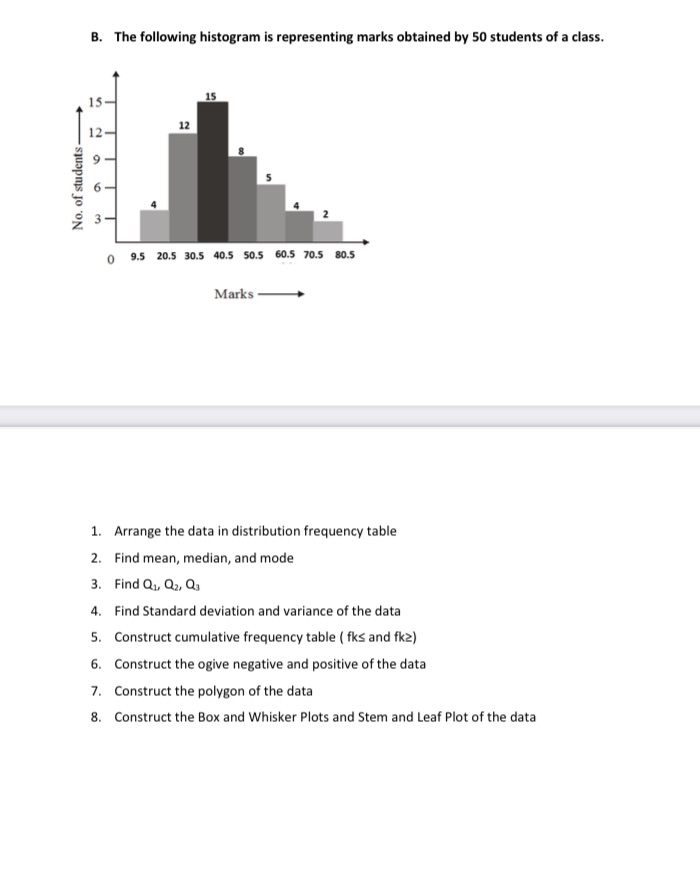
B. The following histogram is representing marks obtained by 50 students of a class. 15- 12- 12 No. of students- 0 9.5 20.5 30.5 40.5 50.5 60.5 70.5 80.5 Marks 1. Arrange the data in distribution frequency table 2. Find mean, median, and mode 3. Find Q1, Qz, Q3 4. Find Standard deviation and variance of the data 5. Construct cumulative frequency table ( fks and fk2) 6. Construct the ogive negative and positive of the data 7. Construct the polygon of the data 8. Construct the Box and Whisker Plots and Stem and Leaf Plot of the data
Step by Step Solution
There are 3 Steps involved in it
1 Expert Approved Answer
Step: 1 Unlock

Question Has Been Solved by an Expert!
Get step-by-step solutions from verified subject matter experts
Step: 2 Unlock
Step: 3 Unlock