

Question: b) The table below presents the expected returns for stocks X and Y for a period of six years. Using the data in table, estimate:
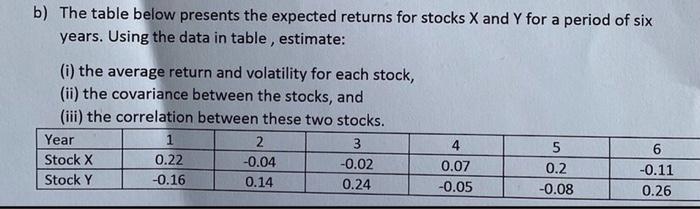
b) The table below presents the expected returns for stocks X and Y for a period of six years. Using the data in table, estimate: (i) the average return and volatility for each stock, (ii) the covariance between the stocks, and (iii) the correlation between these two stocks. Year 1 2 3 Stock X 0.22 -0.04 -0.02 Stock Y -0.16 0.14 0.24 4 0.07 -0.05 5 0.2 -0.08 6 -0.11 0.26
Step by Step Solution
There are 3 Steps involved in it
1 Expert Approved Answer
Step: 1 Unlock

Question Has Been Solved by an Expert!
Get step-by-step solutions from verified subject matter experts
Step: 2 Unlock
Step: 3 Unlock