

Question: b) The weekly demand data is shown in figure below. Find out the exponential smoothing forecasts for periods 2-10 using a=0.10 and a=0.60? Assume F1=D1.
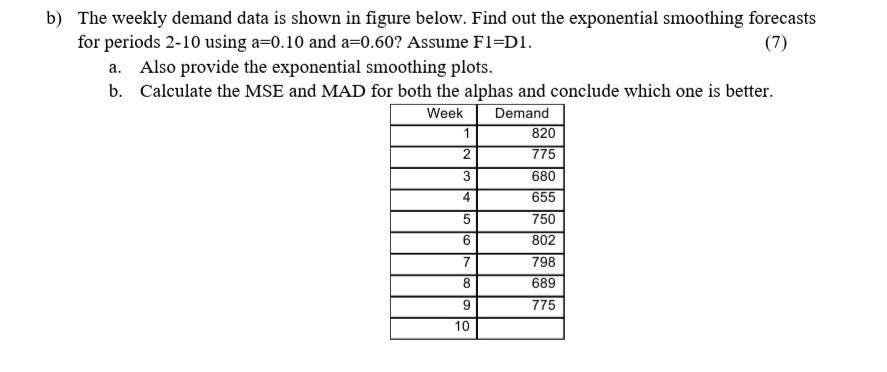
b) The weekly demand data is shown in figure below. Find out the exponential smoothing forecasts for periods 2-10 using a=0.10 and a=0.60? Assume F1=D1. (7) a. Also provide the exponential smoothing plots. b. Calculate the MSE and MAD for both the alphas and conclude which one is better. Week Demand 1 820 2 3 4 5 775 680 655 750 802 798 689 775 6 7 8 9 10
Step by Step Solution
There are 3 Steps involved in it
1 Expert Approved Answer
Step: 1 Unlock

Question Has Been Solved by an Expert!
Get step-by-step solutions from verified subject matter experts
Step: 2 Unlock
Step: 3 Unlock