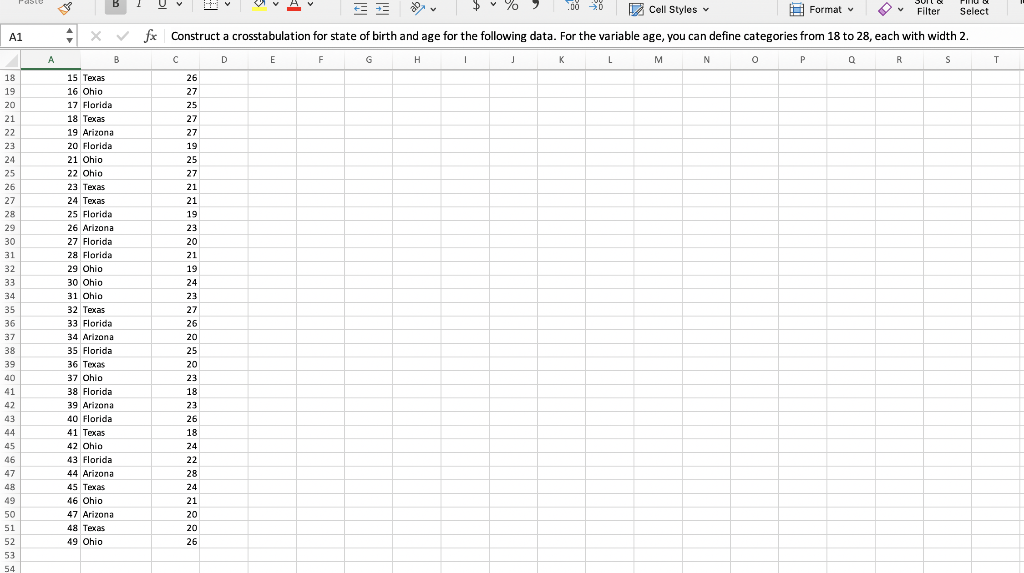
Question: B U % 00 8 Cell Styles Format v Filter Select A1 x fx Construct a crosstabulation for state of birth and age for the

B U % 00 8 Cell Styles Format v Filter Select A1B U % 00 8 Cell Styles Format v Filter Select A1B U % 00 8 Cell Styles Format v Filter Select A1B U % 00 8 Cell Styles Format v Filter Select A1

B U % 00 8 Cell Styles Format v Filter Select A1 x fx Construct a crosstabulation for state of birth and age for the following data. For the variable age, you can define categories from 18 to 28, each with width 2. A B D E F G H 1 j L M N o Q R S T 18 19 20 21 22 23 24 25 26 27 28 29 30 31 32 33 34 35 36 37 38 39 40 41 42 43 44 15 Texas 16 Ohio 17 Florida 18 Texas 19 Arizona 20 Florida 21 Ohio 22 Ohio 23 Texas 24 Texas 25 Florida 26 Arizona 27 Florida 28 Florida 29 Ohio 30 Ohio 31 Ohio 32 Texas 33 Florida 34 Arizona 35 Florida 36 Texas 37 Ohio 38 Florida 39 Arizona 40 Florida 41 Texas 42 Ohio 43 Florida 44 Arizona 45 Texas 46 Ohio 47 Arizona 48 Texas 49 Ohio 26 27 25 27 27 19 25 27 21 21 19 23 20 21 19 24 23 27 26 20 25 20 23 18 23 26 18 24 22 28 24 21 20 20 26 45 46 47 48 50 51 52 53 54 B U % 00 8 Cell Styles Format v Filter Select A1 x fx Construct a crosstabulation for state of birth and age for the following data. For the variable age, you can define categories from 18 to 28, each with width 2. A B D E F G H 1 j L M N o Q R S T 18 19 20 21 22 23 24 25 26 27 28 29 30 31 32 33 34 35 36 37 38 39 40 41 42 43 44 15 Texas 16 Ohio 17 Florida 18 Texas 19 Arizona 20 Florida 21 Ohio 22 Ohio 23 Texas 24 Texas 25 Florida 26 Arizona 27 Florida 28 Florida 29 Ohio 30 Ohio 31 Ohio 32 Texas 33 Florida 34 Arizona 35 Florida 36 Texas 37 Ohio 38 Florida 39 Arizona 40 Florida 41 Texas 42 Ohio 43 Florida 44 Arizona 45 Texas 46 Ohio 47 Arizona 48 Texas 49 Ohio 26 27 25 27 27 19 25 27 21 21 19 23 20 21 19 24 23 27 26 20 25 20 23 18 23 26 18 24 22 28 24 21 20 20 26 45 46 47 48 50 51 52 53 54 LE Paste B I U v v Av V JI Lil T $ v % 9 60 .00 -28 Cell Styles A1 fx Construct the line chart of the population (in millions) of the continents over time in one plot. A B D E F G H 1 j K L M 1 Construct the line chart of the population in millions) of the continents over time in one plot. 2 3 4 5 6 Year Africa The Americas Europe 1950 228 331 543 1955 254 370 574 1960 285 416 605 1965 322 464 634 1970 366 511 657 1975 417 561 677 1980 479 613 694 7 8 9 10 11 12 13 14 15 16 17 18 19 20 21 , Format as Table 1 DX Delete v V Paste B I U A V ll V $ v % MO 9 .00 >0 Ideas Cell Styles Sort & Filter Format v Find & Select V A1 fx Construct a scatter chart to show the relationship between the variables Market Capitalization (vertical axis) and Profit (horizontal axis) for the following sample of firms. A B D E F G H K L M N 0 P Q R 1 Construct a sclatter chart to show the relationship between the variables Market Capitalization (vertical axis) and Profit (horizontal axis) for the following sample of firms. Add a trendile. What does the trendline indicate about this relationship? 2 3 4 Company Market Capitalization ($ millions) 5 6 7 8 9 Profit ($ millions) 845 6007 2560 26790 286 3241 3987 64968 9321 63489 12790 64543 12980 105439 8971 130121 6190 99817 4012 55698 10 11 12 13 14 9 10 15 16 17 18 B U % 00 8 Cell Styles Format v Filter Select A1 x fx Construct a crosstabulation for state of birth and age for the following data. For the variable age, you can define categories from 18 to 28, each with width 2. A B D E F G H 1 j L M N o Q R S T 18 19 20 21 22 23 24 25 26 27 28 29 30 31 32 33 34 35 36 37 38 39 40 41 42 43 44 15 Texas 16 Ohio 17 Florida 18 Texas 19 Arizona 20 Florida 21 Ohio 22 Ohio 23 Texas 24 Texas 25 Florida 26 Arizona 27 Florida 28 Florida 29 Ohio 30 Ohio 31 Ohio 32 Texas 33 Florida 34 Arizona 35 Florida 36 Texas 37 Ohio 38 Florida 39 Arizona 40 Florida 41 Texas 42 Ohio 43 Florida 44 Arizona 45 Texas 46 Ohio 47 Arizona 48 Texas 49 Ohio 26 27 25 27 27 19 25 27 21 21 19 23 20 21 19 24 23 27 26 20 25 20 23 18 23 26 18 24 22 28 24 21 20 20 26 45 46 47 48 50 51 52 53 54 B U % 00 8 Cell Styles Format v Filter Select A1 x fx Construct a crosstabulation for state of birth and age for the following data. For the variable age, you can define categories from 18 to 28, each with width 2. A B D E F G H 1 j L M N o Q R S T 18 19 20 21 22 23 24 25 26 27 28 29 30 31 32 33 34 35 36 37 38 39 40 41 42 43 44 15 Texas 16 Ohio 17 Florida 18 Texas 19 Arizona 20 Florida 21 Ohio 22 Ohio 23 Texas 24 Texas 25 Florida 26 Arizona 27 Florida 28 Florida 29 Ohio 30 Ohio 31 Ohio 32 Texas 33 Florida 34 Arizona 35 Florida 36 Texas 37 Ohio 38 Florida 39 Arizona 40 Florida 41 Texas 42 Ohio 43 Florida 44 Arizona 45 Texas 46 Ohio 47 Arizona 48 Texas 49 Ohio 26 27 25 27 27 19 25 27 21 21 19 23 20 21 19 24 23 27 26 20 25 20 23 18 23 26 18 24 22 28 24 21 20 20 26 45 46 47 48 50 51 52 53 54 LE Paste B I U v v Av V JI Lil T $ v % 9 60 .00 -28 Cell Styles A1 fx Construct the line chart of the population (in millions) of the continents over time in one plot. A B D E F G H 1 j K L M 1 Construct the line chart of the population in millions) of the continents over time in one plot. 2 3 4 5 6 Year Africa The Americas Europe 1950 228 331 543 1955 254 370 574 1960 285 416 605 1965 322 464 634 1970 366 511 657 1975 417 561 677 1980 479 613 694 7 8 9 10 11 12 13 14 15 16 17 18 19 20 21 , Format as Table 1 DX Delete v V Paste B I U A V ll V $ v % MO 9 .00 >0 Ideas Cell Styles Sort & Filter Format v Find & Select V A1 fx Construct a scatter chart to show the relationship between the variables Market Capitalization (vertical axis) and Profit (horizontal axis) for the following sample of firms. A B D E F G H K L M N 0 P Q R 1 Construct a sclatter chart to show the relationship between the variables Market Capitalization (vertical axis) and Profit (horizontal axis) for the following sample of firms. Add a trendile. What does the trendline indicate about this relationship? 2 3 4 Company Market Capitalization ($ millions) 5 6 7 8 9 Profit ($ millions) 845 6007 2560 26790 286 3241 3987 64968 9321 63489 12790 64543 12980 105439 8971 130121 6190 99817 4012 55698 10 11 12 13 14 9 10 15 16 17 18

Step by Step Solution

There are 3 Steps involved in it

1 Expert Approved Answer
Step: 1 Unlock blur-text-image
Question Has Been Solved by an Expert!

Get step-by-step solutions from verified subject matter experts

Step: 2 Unlock
Step: 3 Unlock

Students Have Also Explored These Related General Management Questions!