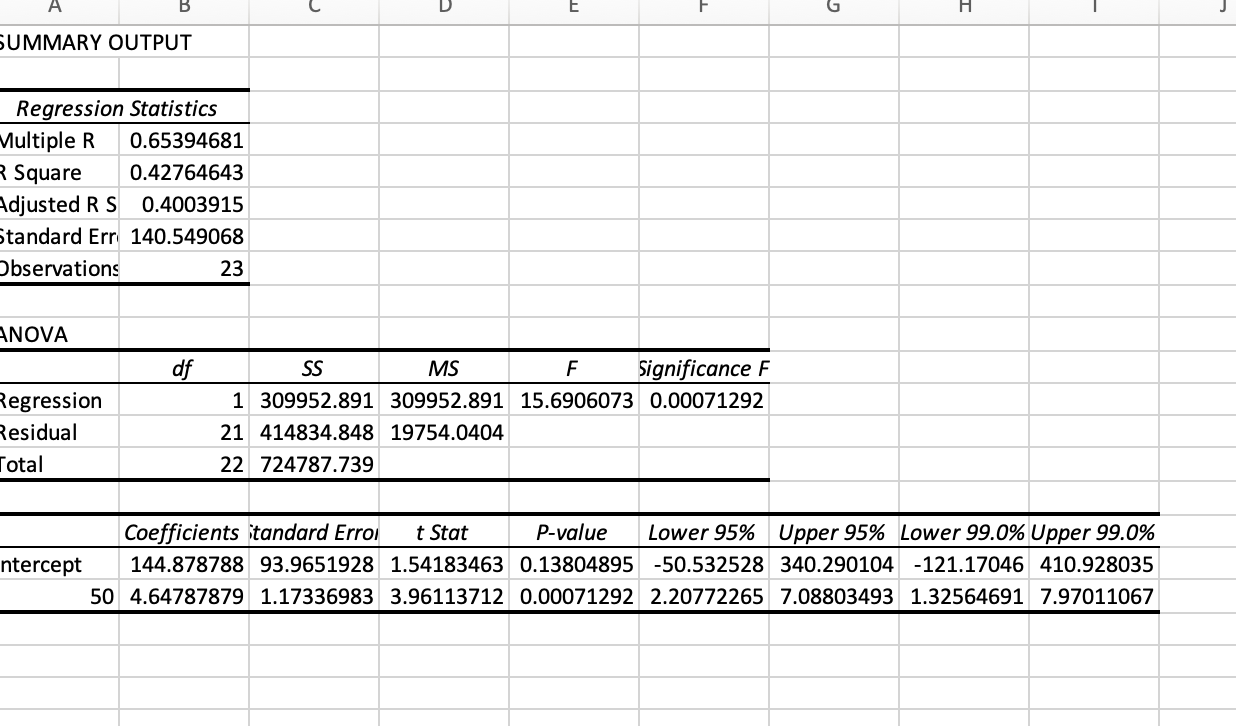
Question: B u E F G I H SUMMARY OUTPUT Regression Statistics Multiple R 0.65394681 R Square 0.42764643 Adjusted RS 0.4003915 Standard Err 140.549068 Observations 23

B u E F G I H SUMMARY OUTPUT RegressionB u E F G I H SUMMARY OUTPUT Regression

B u E F G I H SUMMARY OUTPUT Regression Statistics Multiple R 0.65394681 R Square 0.42764643 Adjusted RS 0.4003915 Standard Err 140.549068 Observations 23 ANOVA df Regression Residual Total SS MS F Significance F 1 309952.891 309952.891 15.6906073 0.00071292 21 414834.848 19754.0404 22 724787.739 Coefficients tandard Erroi t Stat P-value Lower 95% Upper 95% Lower 99.0% Upper 99.0% ntercept 144.878788 93.9651928 1.54183463 0.13804895 -50.532528 340.290104 - 121.17046 410.928035 50 4.64787879 1.17336983 3.96113712 0.00071292 2.20772265 7.08803493 1.32564691 7.97011067 Download/open Tyler.xlsx and run a regression report using Price and Advertising Expenditure ($1000s) to predict Sales (1000s), if you haven't already done so. Check the box next to each variable that is significant at the 99% confidence level. Intercept Price Advertising Expenditure ($1000s)

Step by Step Solution

There are 3 Steps involved in it

1 Expert Approved Answer
Step: 1 Unlock blur-text-image
Question Has Been Solved by an Expert!

Get step-by-step solutions from verified subject matter experts

Step: 2 Unlock
Step: 3 Unlock

Students Have Also Explored These Related General Management Questions!