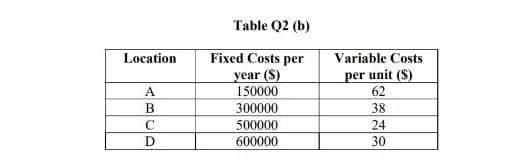
Question: (b) Using location break-even analysis and referring to Table Q2 (b), (1) Analyze the break-even by showing all break-even points along with the quantities by

(b) Using location break-even analysis and(b) Using location break-even analysis and

(b) Using location break-even analysis and referring to Table Q2 (b), (1) Analyze the break-even by showing all break-even points along with the quantities by plotting the graph if the units cost is 20,000 units. (10 marks) (ii) Interpret which location is the best. (2 marks) Table Q2 (b) Location A B Fixed Costs per year (S) 150000 300000 500000 600000 Variable Costs per unit (S) 62 38 24 30

Step by Step Solution

There are 3 Steps involved in it

1 Expert Approved Answer
Step: 1 Unlock blur-text-image
Question Has Been Solved by an Expert!

Get step-by-step solutions from verified subject matter experts

Step: 2 Unlock
Step: 3 Unlock

Students Have Also Explored These Related General Management Questions!