

Question: b) Using the 3-year moving average, provide the forecast from periods 4 through 12 (round your responses to one decimalplace). Year 4 5 6 7
b) Using the 3-year moving average, provide the forecast from periods 4 through 12 (round your responses to one decimalplace).
Year 4 5 6 7 8 9 10 11 12
Forecast
c) Using the 3-year weighted moving average with weights 0.15, 0.35, and 0.50, using 0.50 for the most recent period, provide the forecast from periods 4 through 12 (round your responses to two decimal places).
Year 4 5 6 7 8 9 10 11 12
Forecast
d) Mean absolute deviation for the forecast developed using the3-year moving average is 2.49 and for the 3-year weighted moving average is 2.83. Based on this information, the better forecast is achieved using the ______ approach.
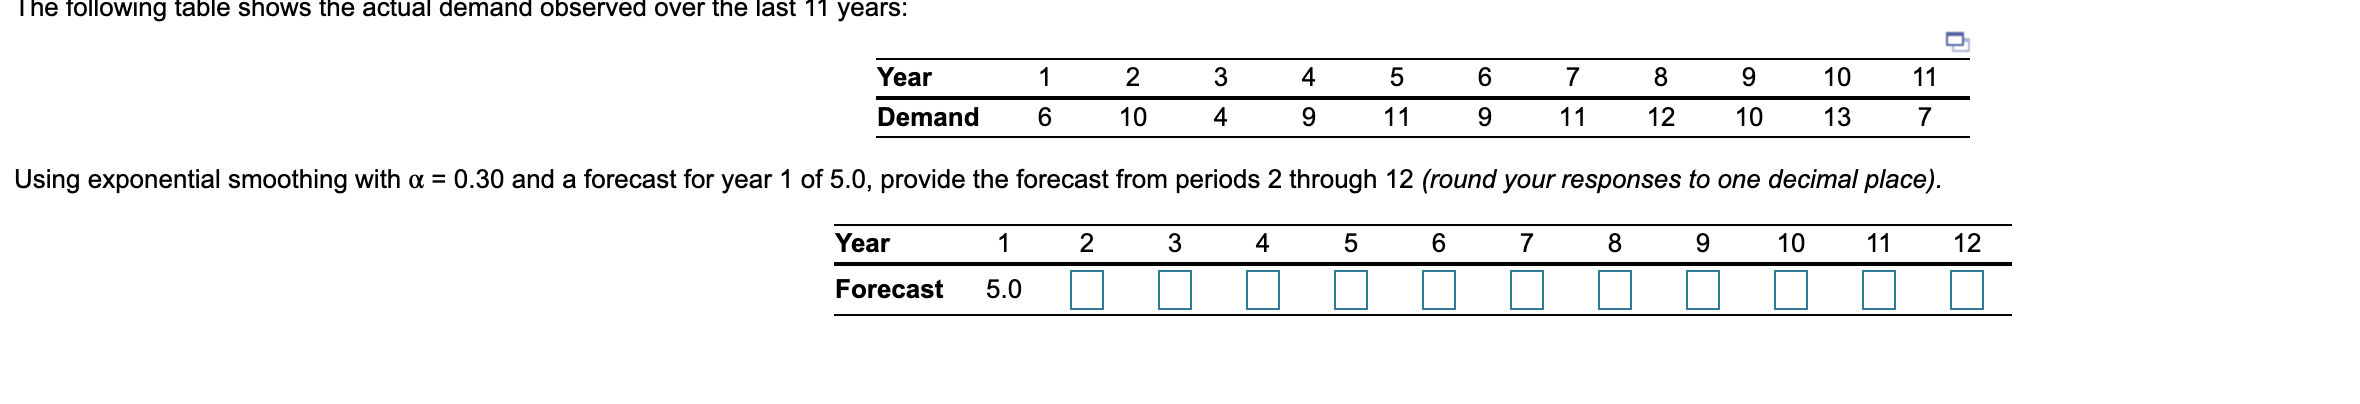
The following table shows the actual demand observed over the last 11 years: Year 3 4 1 6 2 104 5 11 6 9 7 11 8 12 9 10 10 13 11 7 Demand 9 Using exponential smoothing with a = 0.30 and a forecast for year 1 of 5.0, provide the forecast from periods 2 through 12 (round your responses to one decimal place). Year 1 2 3 4 5 6 7 8 9 10 11 12 Forecast 5.0 0 0 0 0 0 0 0 0 0 0 0Step by Step Solution
There are 3 Steps involved in it

Get step-by-step solutions from verified subject matter experts