

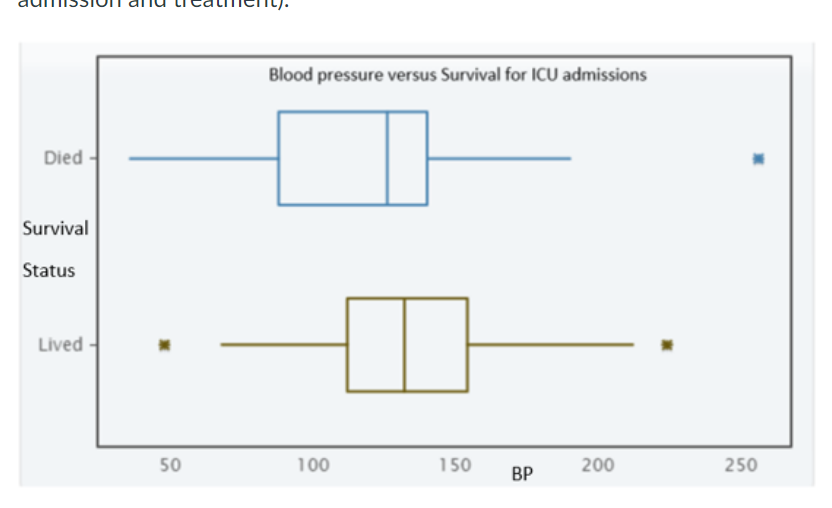
Question: b) Using the side by side plot above, estimate the following requested below - pick the most appropriate result that ts. If it is not

![{ONLY THIS GROUP). Min: [59'9\"] V Lower Quartile: [Select] V Mean: [Select]](https://s3.amazonaws.com/si.experts.images/answers/2024/06/666842df11dbb_895666842df02291.jpg)
![v Median: [59'9\"] V Upper Quartile: [Select] v Max: [ Select] v](https://s3.amazonaws.com/si.experts.images/answers/2024/06/666842df6973d_895666842df52042.jpg)
b) Using the side by side plot above, estimate the following requested below - pick the most appropriate result that ts. If it is not possible to estimate the item requested from this graph, then state \"NP" for not possible. Survival: LIVED summary results for Blood pressure {ONLY THIS GROUP). Min: [59'9\"] V Lower Quartile: [Select] V Mean: [Select] v Median: [59'9\"] V Upper Quartile: [Select] v Max: [ Select] v c) Identified Outliers (list those values): [ Select ] V d) For LIVED Status boxplot, what is the shape and why? (must give support to your answer of why it is OR why it is not) [ Select ]
Step by Step Solution
There are 3 Steps involved in it
1 Expert Approved Answer
Step: 1 Unlock

Question Has Been Solved by an Expert!
Get step-by-step solutions from verified subject matter experts
Step: 2 Unlock
Step: 3 Unlock