

Question: b) Write a possible VAR model for representing the Impulse Response Function pictured in Graph 3. Which test could we implement to assess the causality
b) Write a possible VAR model for representing the Impulse Response Function pictured in Graph 3. Which test could we implement to assess the causality in a multivariate model? Explain it briefly and try to figure out a possible causality between monetary policy instruments and respectively IP, unemployment rate, and CPI.
d) Describe the advantage of using a time-varying coefficient VAR model in particular for forecasting purposes
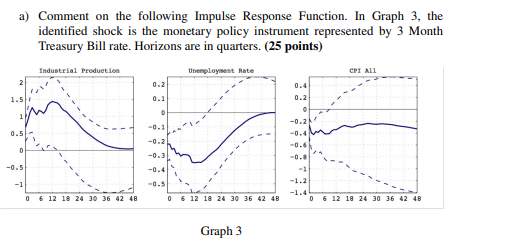
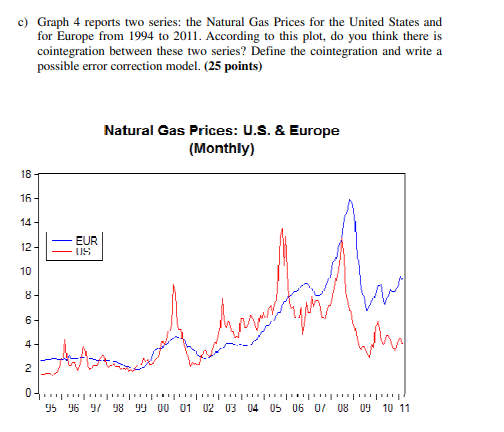
a) Comment on the following Impulse Response Function. In Graph 3, the identified shock is the monetary policy instrument represented by 3 Month Treasury Bill rate. Horizons are in quarters. (25 points) Industrial Production Unemployment late CPI ALI 0.4 0.2 1.5 0.2 0.1 0 -0.1 1 -0.2 0.5- 0 -0.2 -0.31 -0.4 -0.6 -0.0 -0.5 -1 -0.5 0 6 12 18 24 30 36 42 43 0 6 12 18 24 30 36 42 48 0 6 12 18 24 30 36 42 43 Graph 3 c) Graph 4 reports two series: the Natural Gas Prices for the United States and for Europe from 1994 to 2011. According to this plot, do you think there is cointegration between these two series? Define the cointegration and write a possible error correction model. (25 points) Natural Gas Prices: U.S. & Europe (Monthly) 18 16 14 12- EUR US 10 8 - 6 A sada 4 - why 2 01.. 95 96 97 98 99 00 01 02 03 04 05 06 07 08 09 10 11 a) Comment on the following Impulse Response Function. In Graph 3, the identified shock is the monetary policy instrument represented by 3 Month Treasury Bill rate. Horizons are in quarters. (25 points) Industrial Production Unemployment late CPI ALI 0.4 0.2 1.5 0.2 0.1 0 -0.1 1 -0.2 0.5- 0 -0.2 -0.31 -0.4 -0.6 -0.0 -0.5 -1 -0.5 0 6 12 18 24 30 36 42 43 0 6 12 18 24 30 36 42 48 0 6 12 18 24 30 36 42 43 Graph 3 c) Graph 4 reports two series: the Natural Gas Prices for the United States and for Europe from 1994 to 2011. According to this plot, do you think there is cointegration between these two series? Define the cointegration and write a possible error correction model. (25 points) Natural Gas Prices: U.S. & Europe (Monthly) 18 16 14 12- EUR US 10 8 - 6 A sada 4 - why 2 01.. 95 96 97 98 99 00 01 02 03 04 05 06 07 08 09 10 11
Step by Step Solution
There are 3 Steps involved in it

Get step-by-step solutions from verified subject matter experts