

Question: B-1. 14 marks]: Identify and list all variables from Table 1, make a list of them, and print them on the output cell. What
![B-1. 14 marks]: Identify and list all variables from Table 1, make a list of them, and print them on the](https://dsd5zvtm8ll6.cloudfront.net/si.experts.images/questions/2023/10/651a513a4562a_1696223544845.jpg)
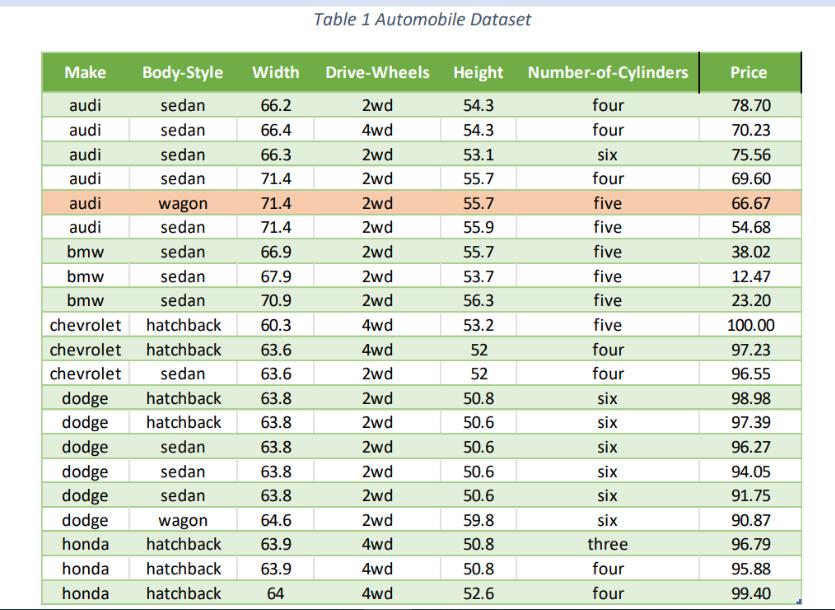
B-1. 14 marks]: Identify and list all variables from Table 1, make a list of them, and print them on the output cell. What does Figure I's data represent? B-2. 15 marks]: Classify the variables in Table 1 into field types, make a list to hold the identified field types, use the zip() function to zip the field name with its type, and then print the zipped data in a table format with the headers Field Name and Field Type. B-3. [3 marks]: Study Table 1, and determine for each variable its type as either independent or dependent. Then, use a list to store the type per each variable and print them as a table Field Name Field Type Independent Var. Note the values of the Independent Var field should be either Yes or No B-4. [3 marks]: Using the data in Table 1, plot a histogram of the Body-Style field. Configure the plot with the label "Cars Body-Style" on the horizontal axis and "Frequency" on the vertical axis. Finally, use "Body-Style Histogram" as a plot title. B-5. [6 marks]: Using Price field from Table 1, we want to generate and plot a histogram with 5 bins. First, compute the bin width and determine the bin range (start value and end value of each bin). Then, configure the plot with Car Prices Histogram as a title, Frequency as a y- axis label, and Cars Prices as an x-axis label. B-6. 15 marks]: Plot the pie chart for Number-of-Cylinders. Configure your pie plot to show data labels consisting of percentages (one decimal place) along with a count (shown in parentheses). For example, 33.3% (count - 7). B-7. 15 marks]: For each Audi and Dodge car, find and print the mean and median Price with three decimal places. B-8. [4 marks]: Convert the values in the Width field to integers and compute the field mode. B-9. 15 marks]: Identify the outliers in each numerical variable in Tabe 1, if any, print them, and use the appropriate approach to depict them visually. B-10. Given the scores of students in two homeworks (HWI and HW2) as listed below. HW1 = [45, 50, 55, 60, 55, 75, 70, 75, 70, 70, 75, 100, 60, 70, 60, 80, 81, 71, 50, 60, 75, 55, 70, 80, 100] HW2= [ 60, 80, 60, 70.5, 60.5, 70, 61, 72, 77, 60, 50, 65, 60, 60, 81, 79, 60, 70, 53, 40, 50, 100, 70, 60, 95] Make Body-Style Width sedan 66.2 sedan 66.4 sedan 66.3 sedan 71.4 audi audi audi audi 71.4 71.4 66.9 sedan 67.9 sedan 70.9 chevrolet hatchback 60.3 chevrolet hatchback 63.6 chevrolet sedan 63.6 dodge hatchback 63.8 dodge hatchback 63.8 dodge sedan 63.8 dodge sedan 63.8 dodge sedan 63.8 dodge wagon 64.6 honda hatchback 63.9 honda hatchback 63.9 honda hatchback 64 audi audi bmw bmw bmw wagon sedan sedan Table 1 Automobile Dataset Drive-Wheels Height Number-of-Cylinders 2wd 54.3 four 4wd 54.3 four 53.1 six 55.7 four 55.7 55.9 55.7 53.7 56.3 53.2 52 2wd 2wd 2wd 2wd 2wd 2wd 2wd 4wd 4wd 2wd 2wd 2wd 2wd 2wd 2wd 2wd 4wd 4wd 4wd 52 50.8 50.6 50.6 50.6 50.6 59.8 50.8 50.8 52.6 five five five five five five four four six six six six six six three four four Price 78.70 70.23 75.56 69.60 66.67 54.68 38.02 12.47 23.20 100.00 97.23 96.55 98.98 97.39 96.27 94.05 91.75 90.87 96.79 95.88 99.40
Step by Step Solution
3.41 Rating (145 Votes )
There are 3 Steps involved in it
Solutions Step 1 B1 Identity and list all variables from Table 1 Make a list of them and print them Variables in Table 1 Make Body style Width Drive wheels Height Number of Cylinders Price What does F... View full answer

Get step-by-step solutions from verified subject matter experts