Question: B14 X V fx =B10-B13 A B C D E F G H K 1 Exported from Calcbench: Mon Jan 03 2022 14:11:44 GMT-0700 (Mountain
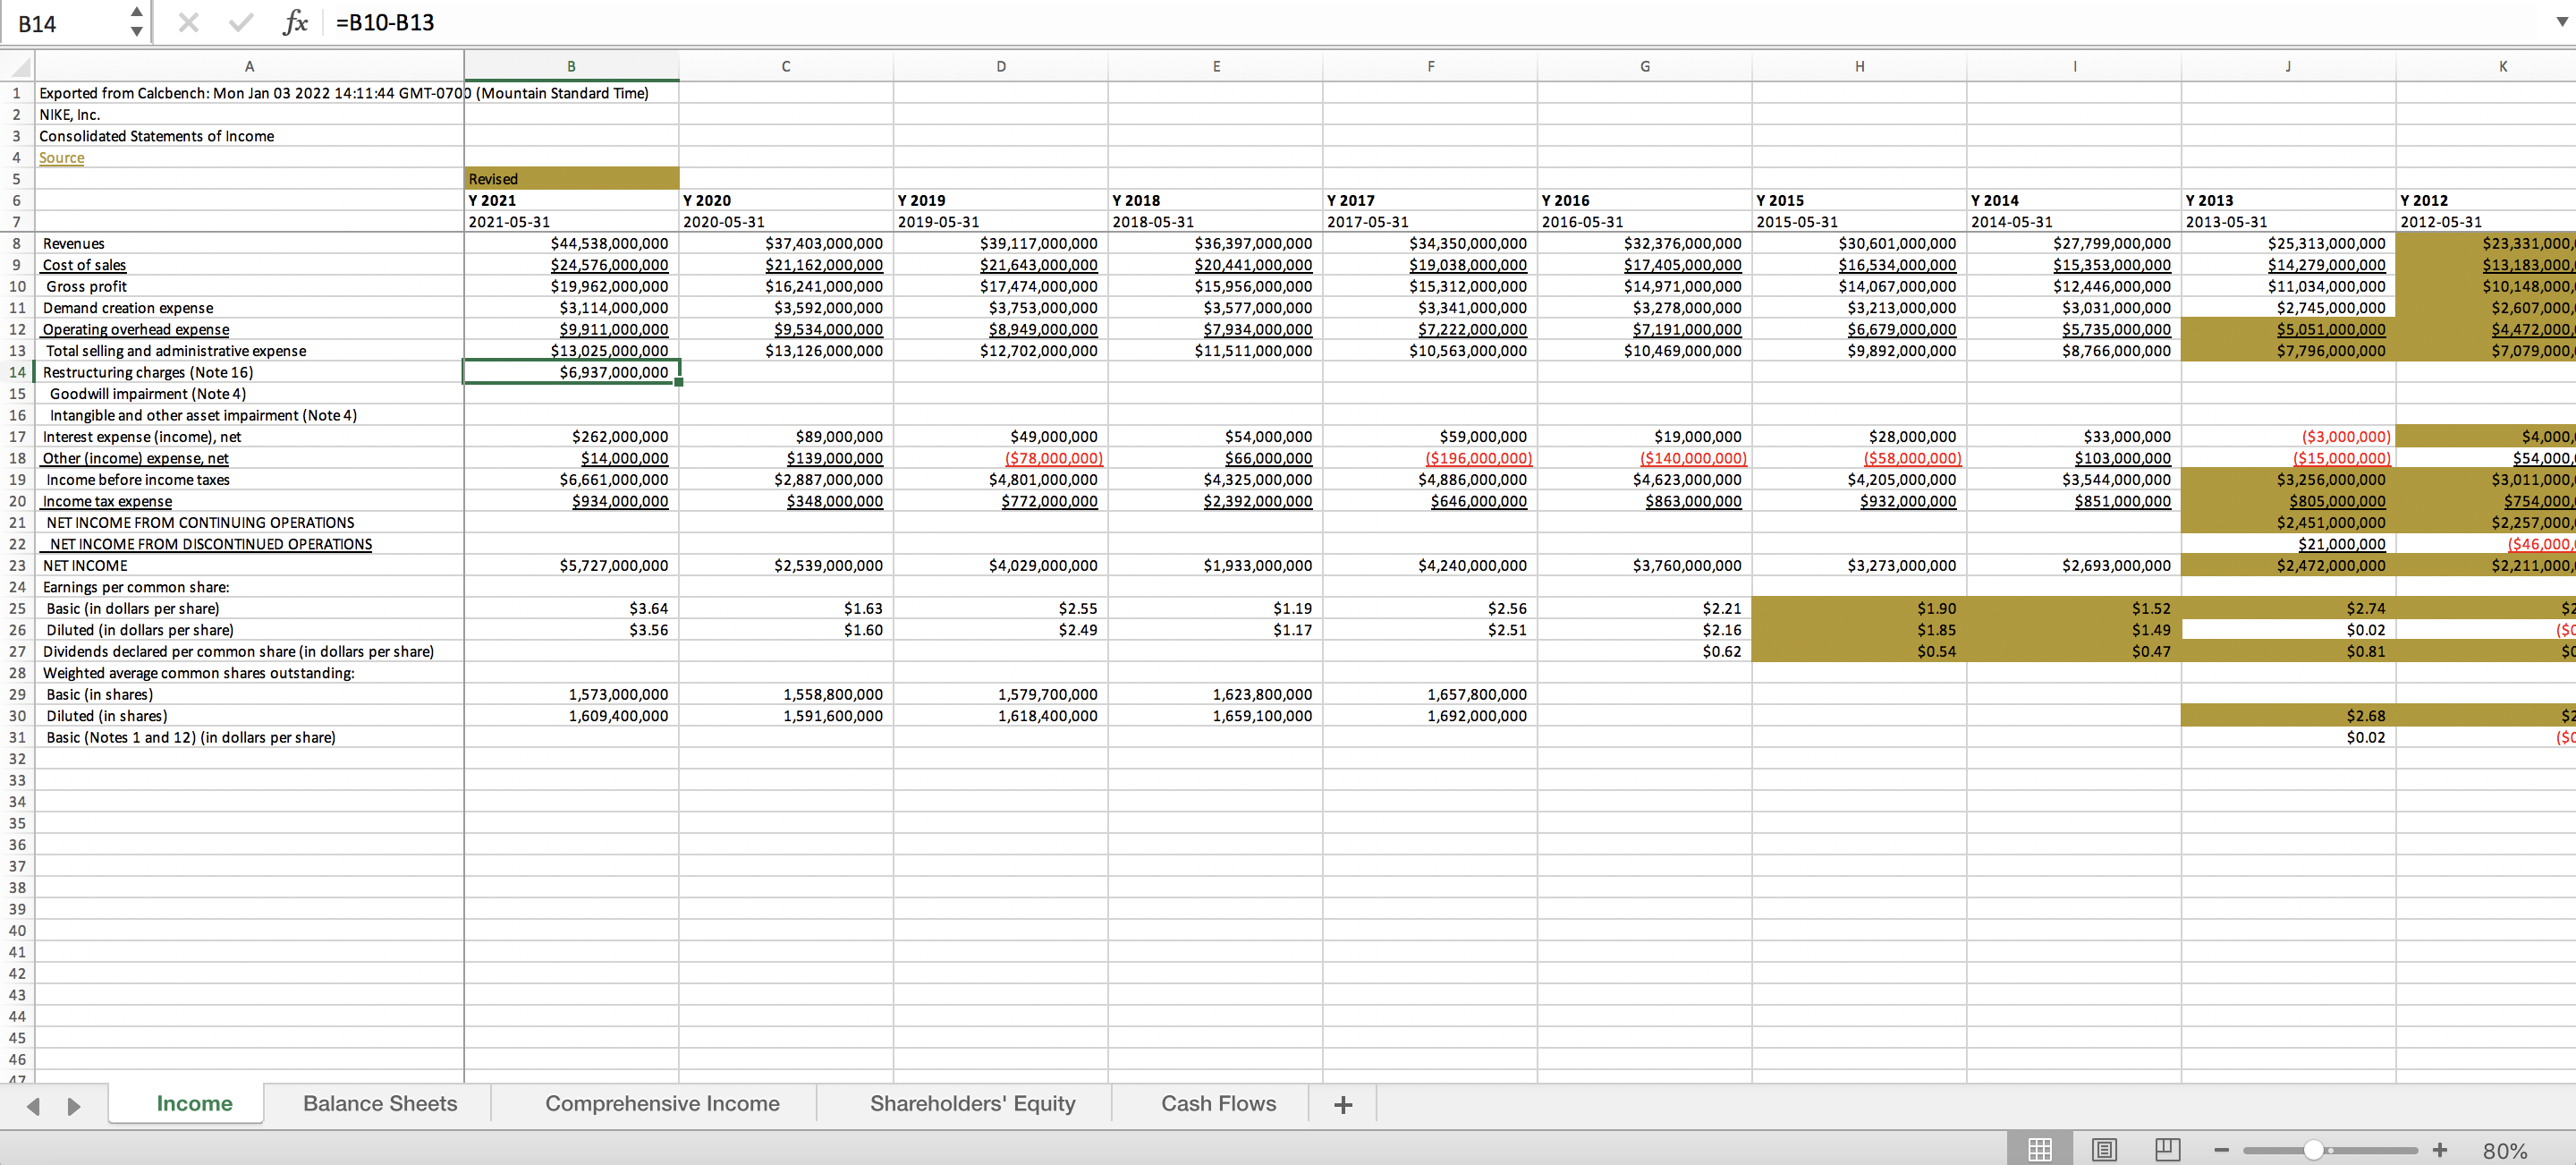
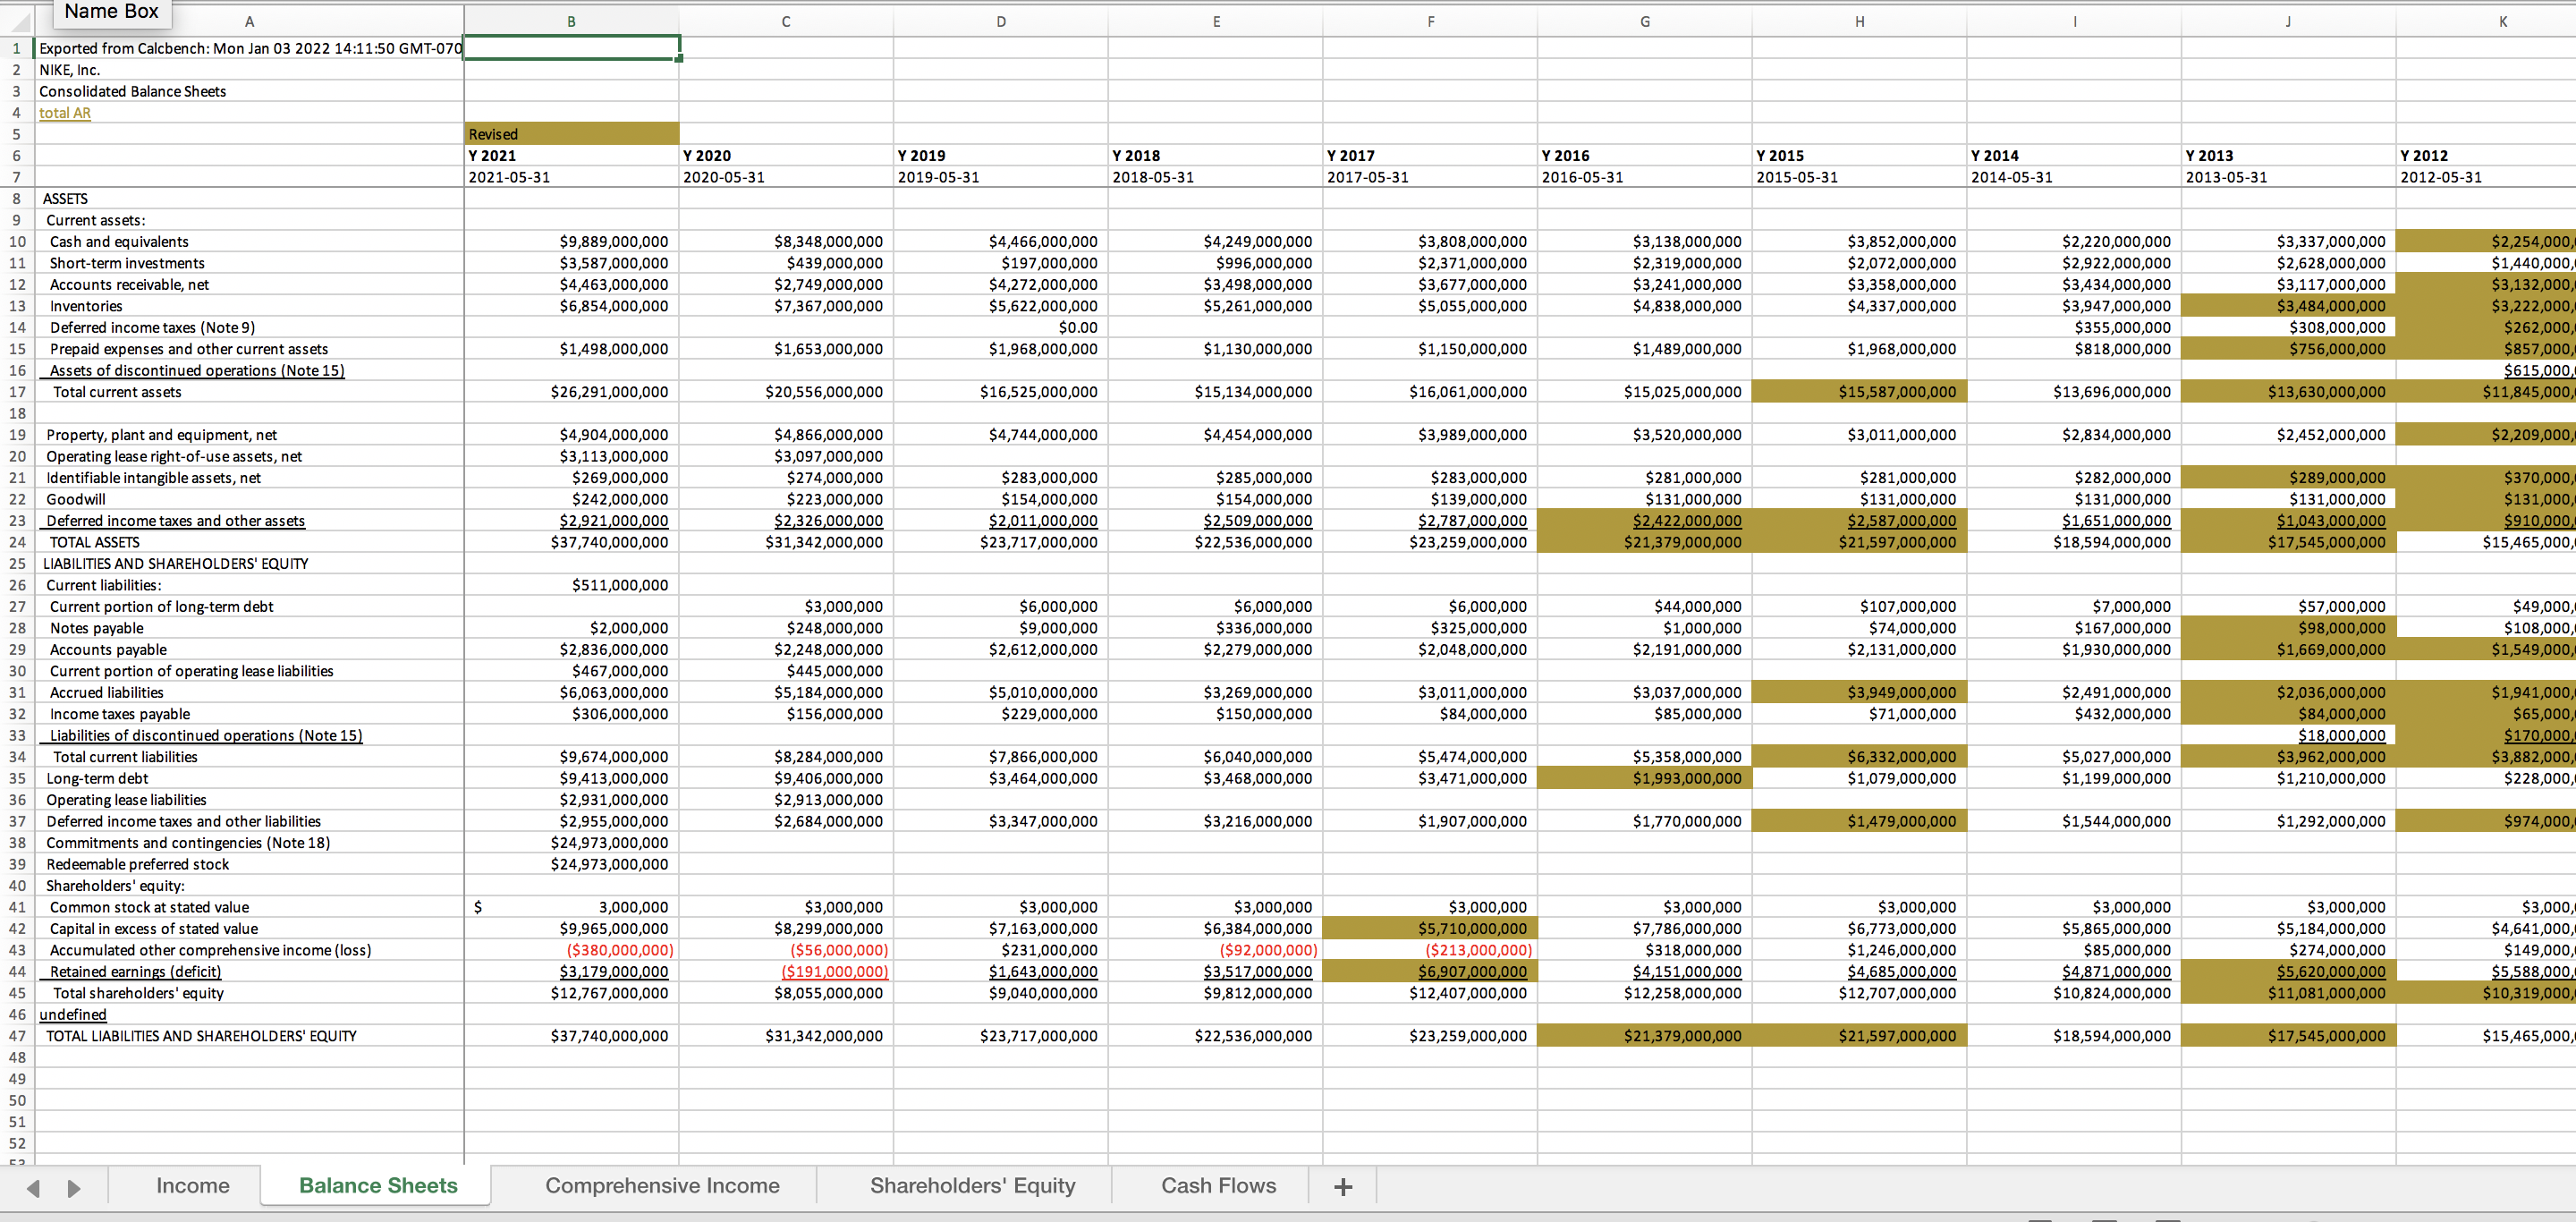
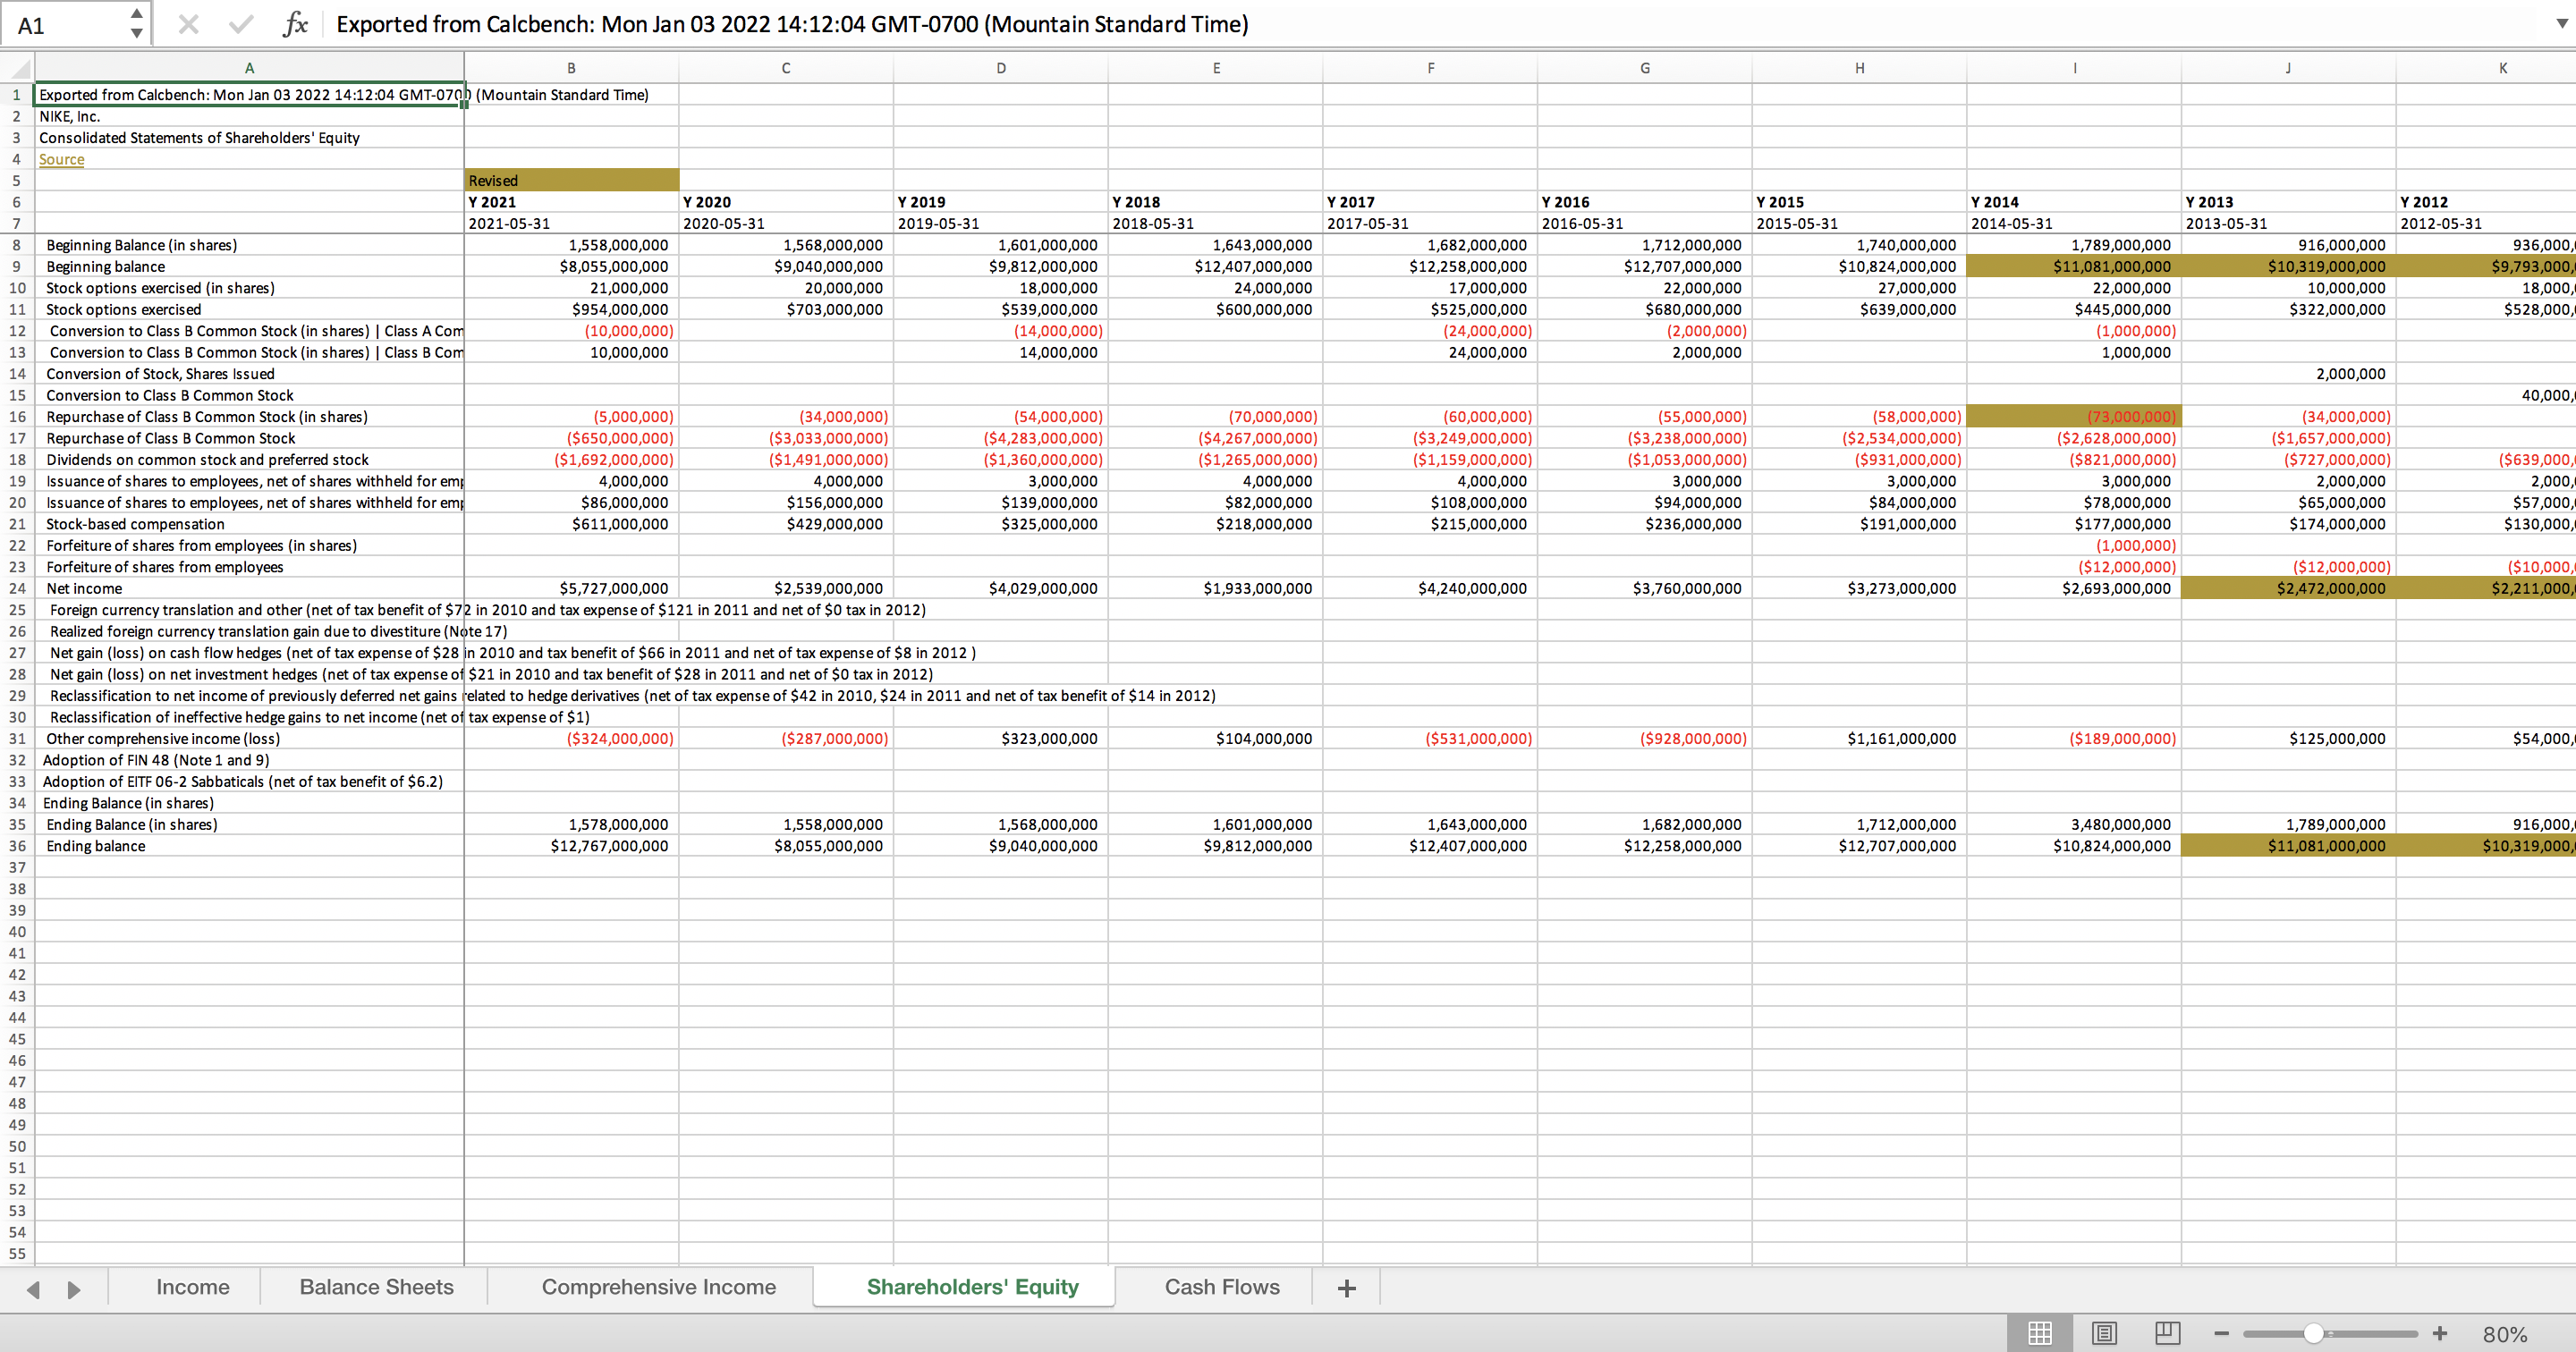
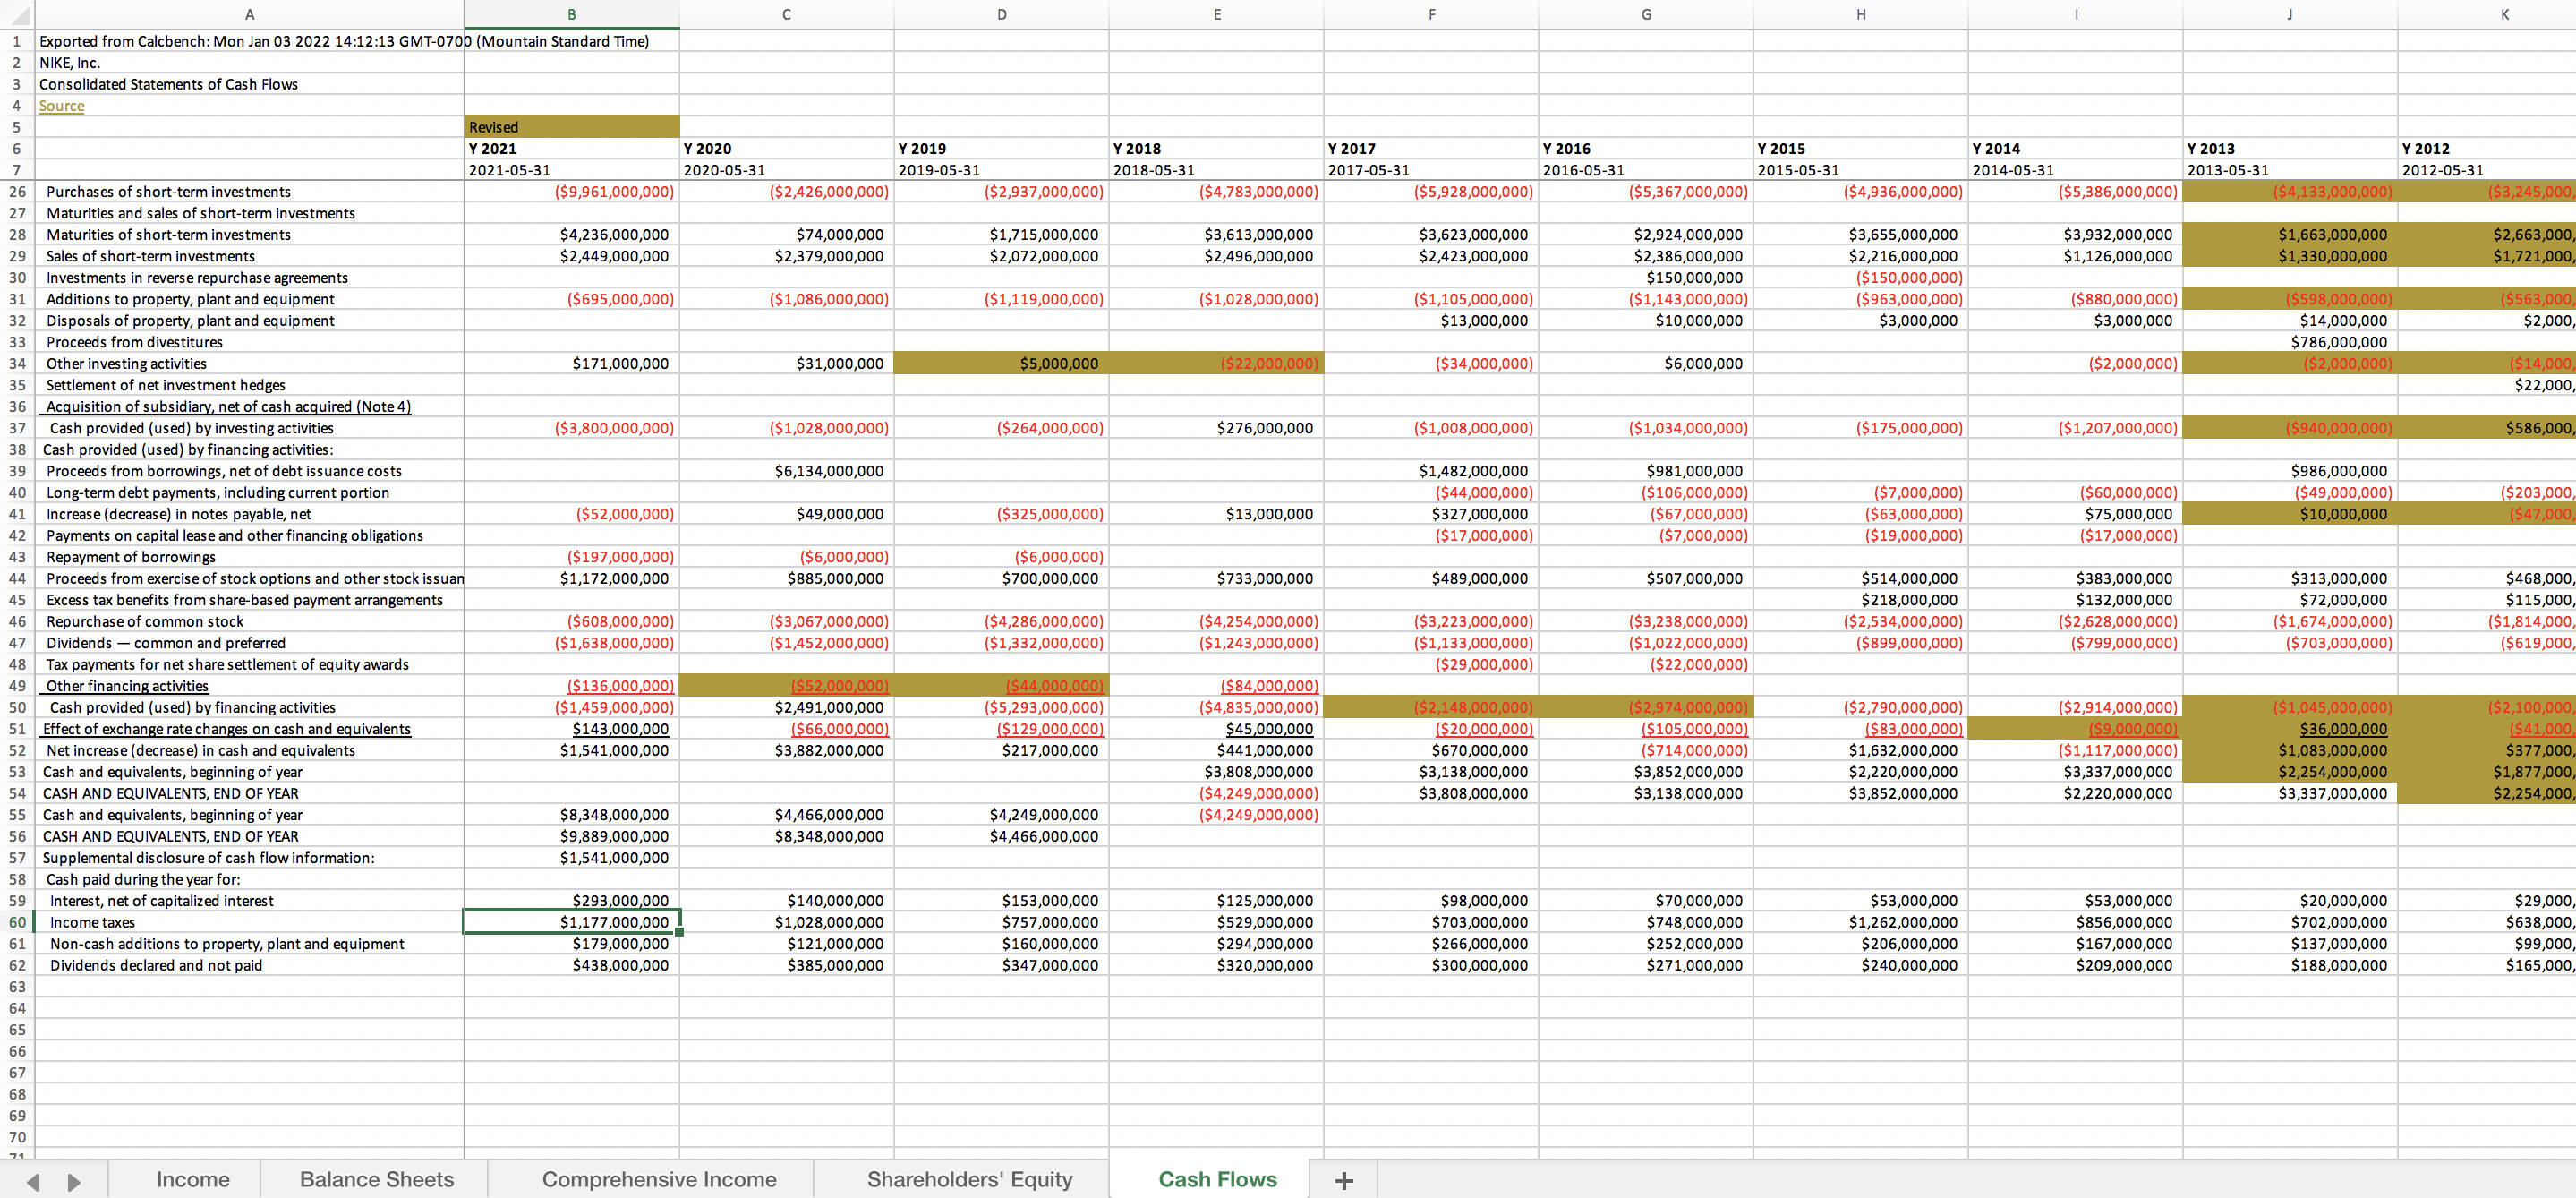
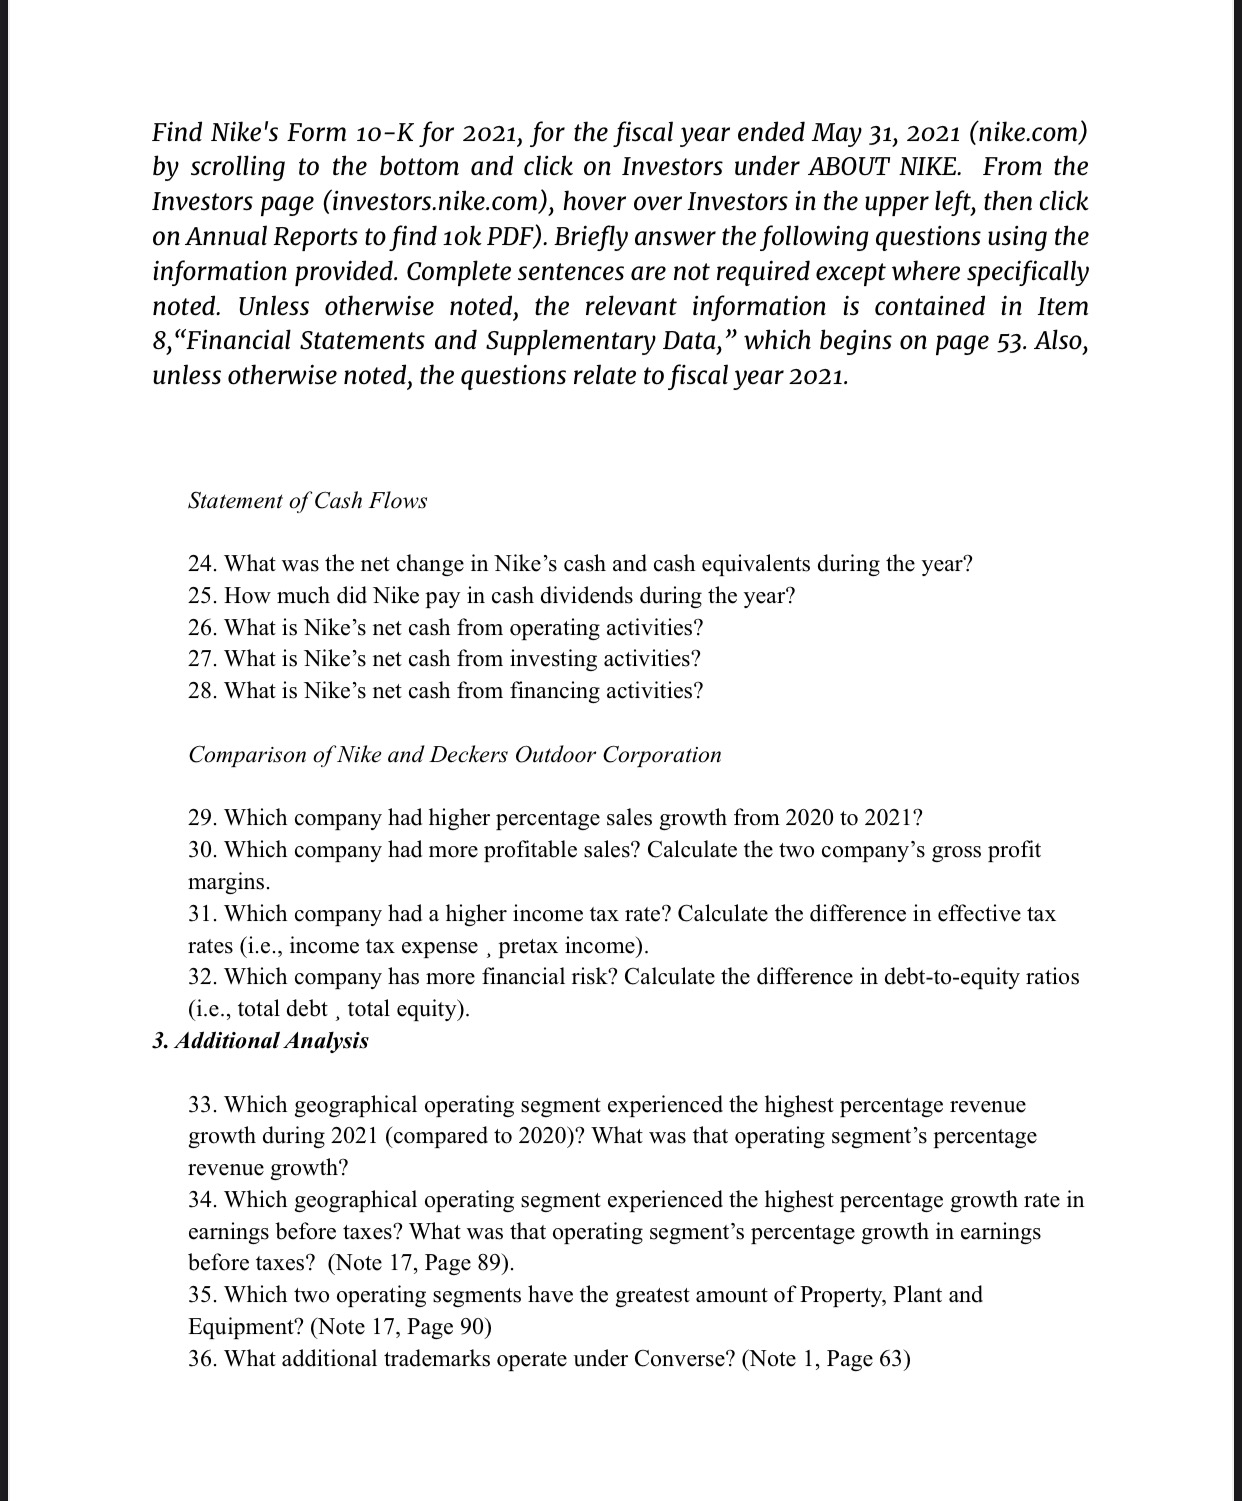
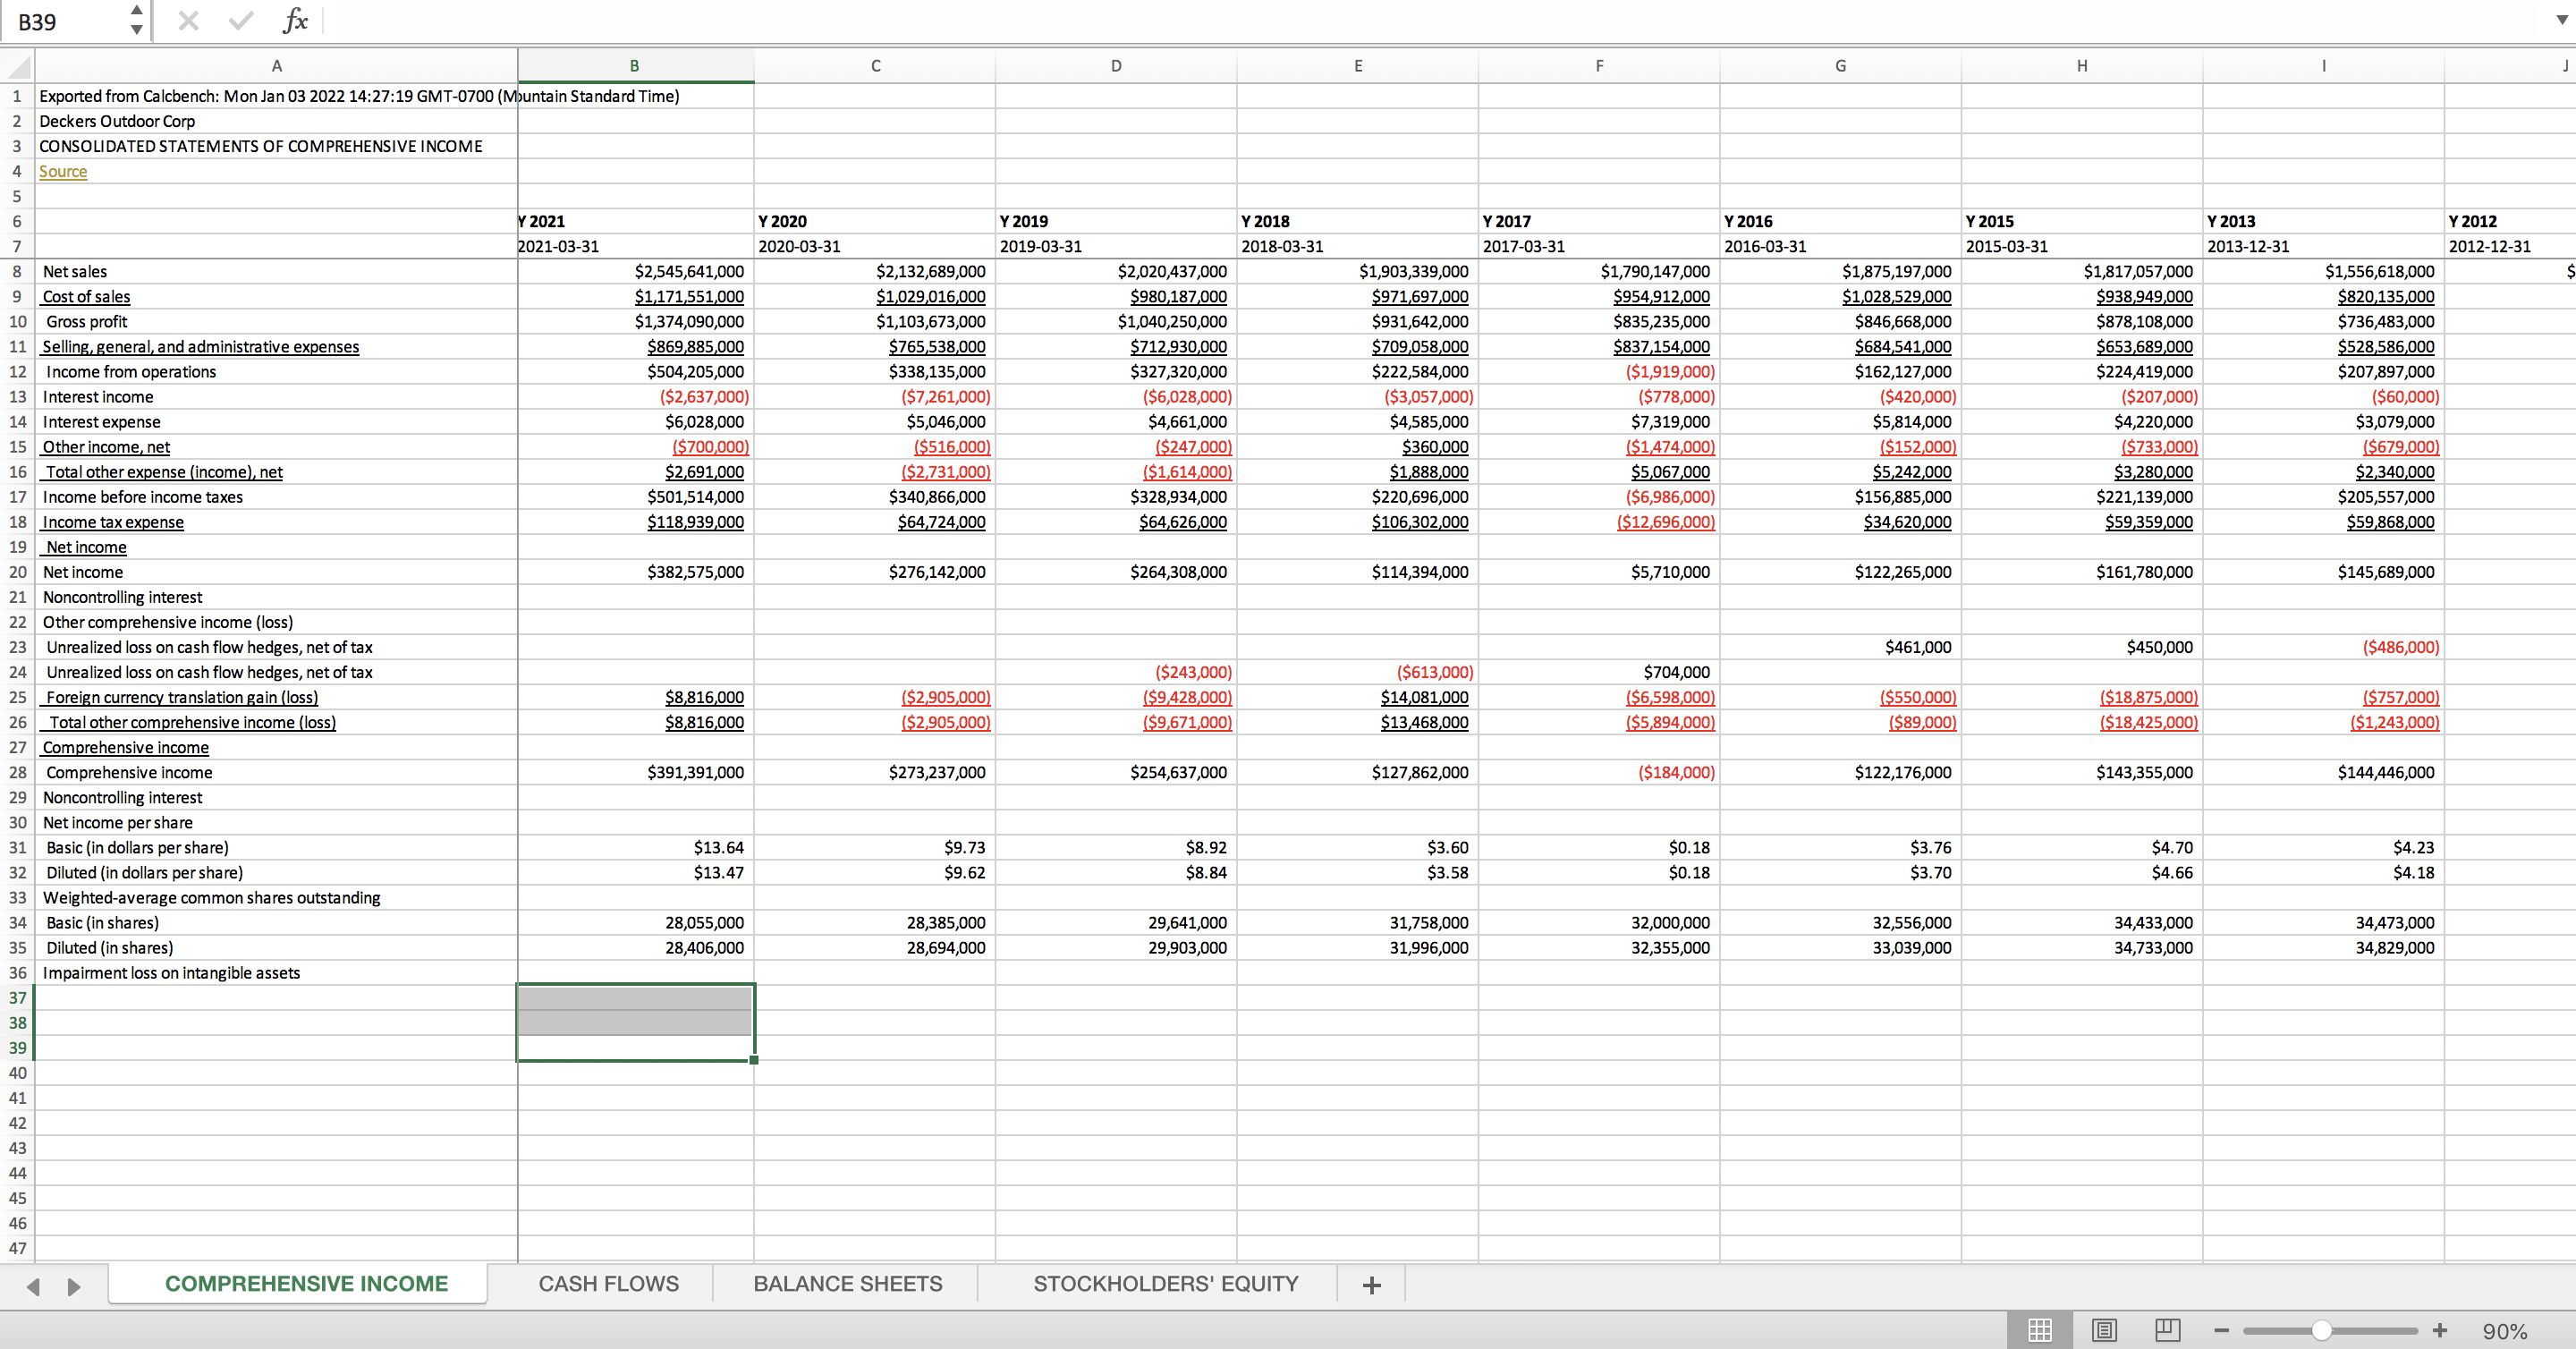
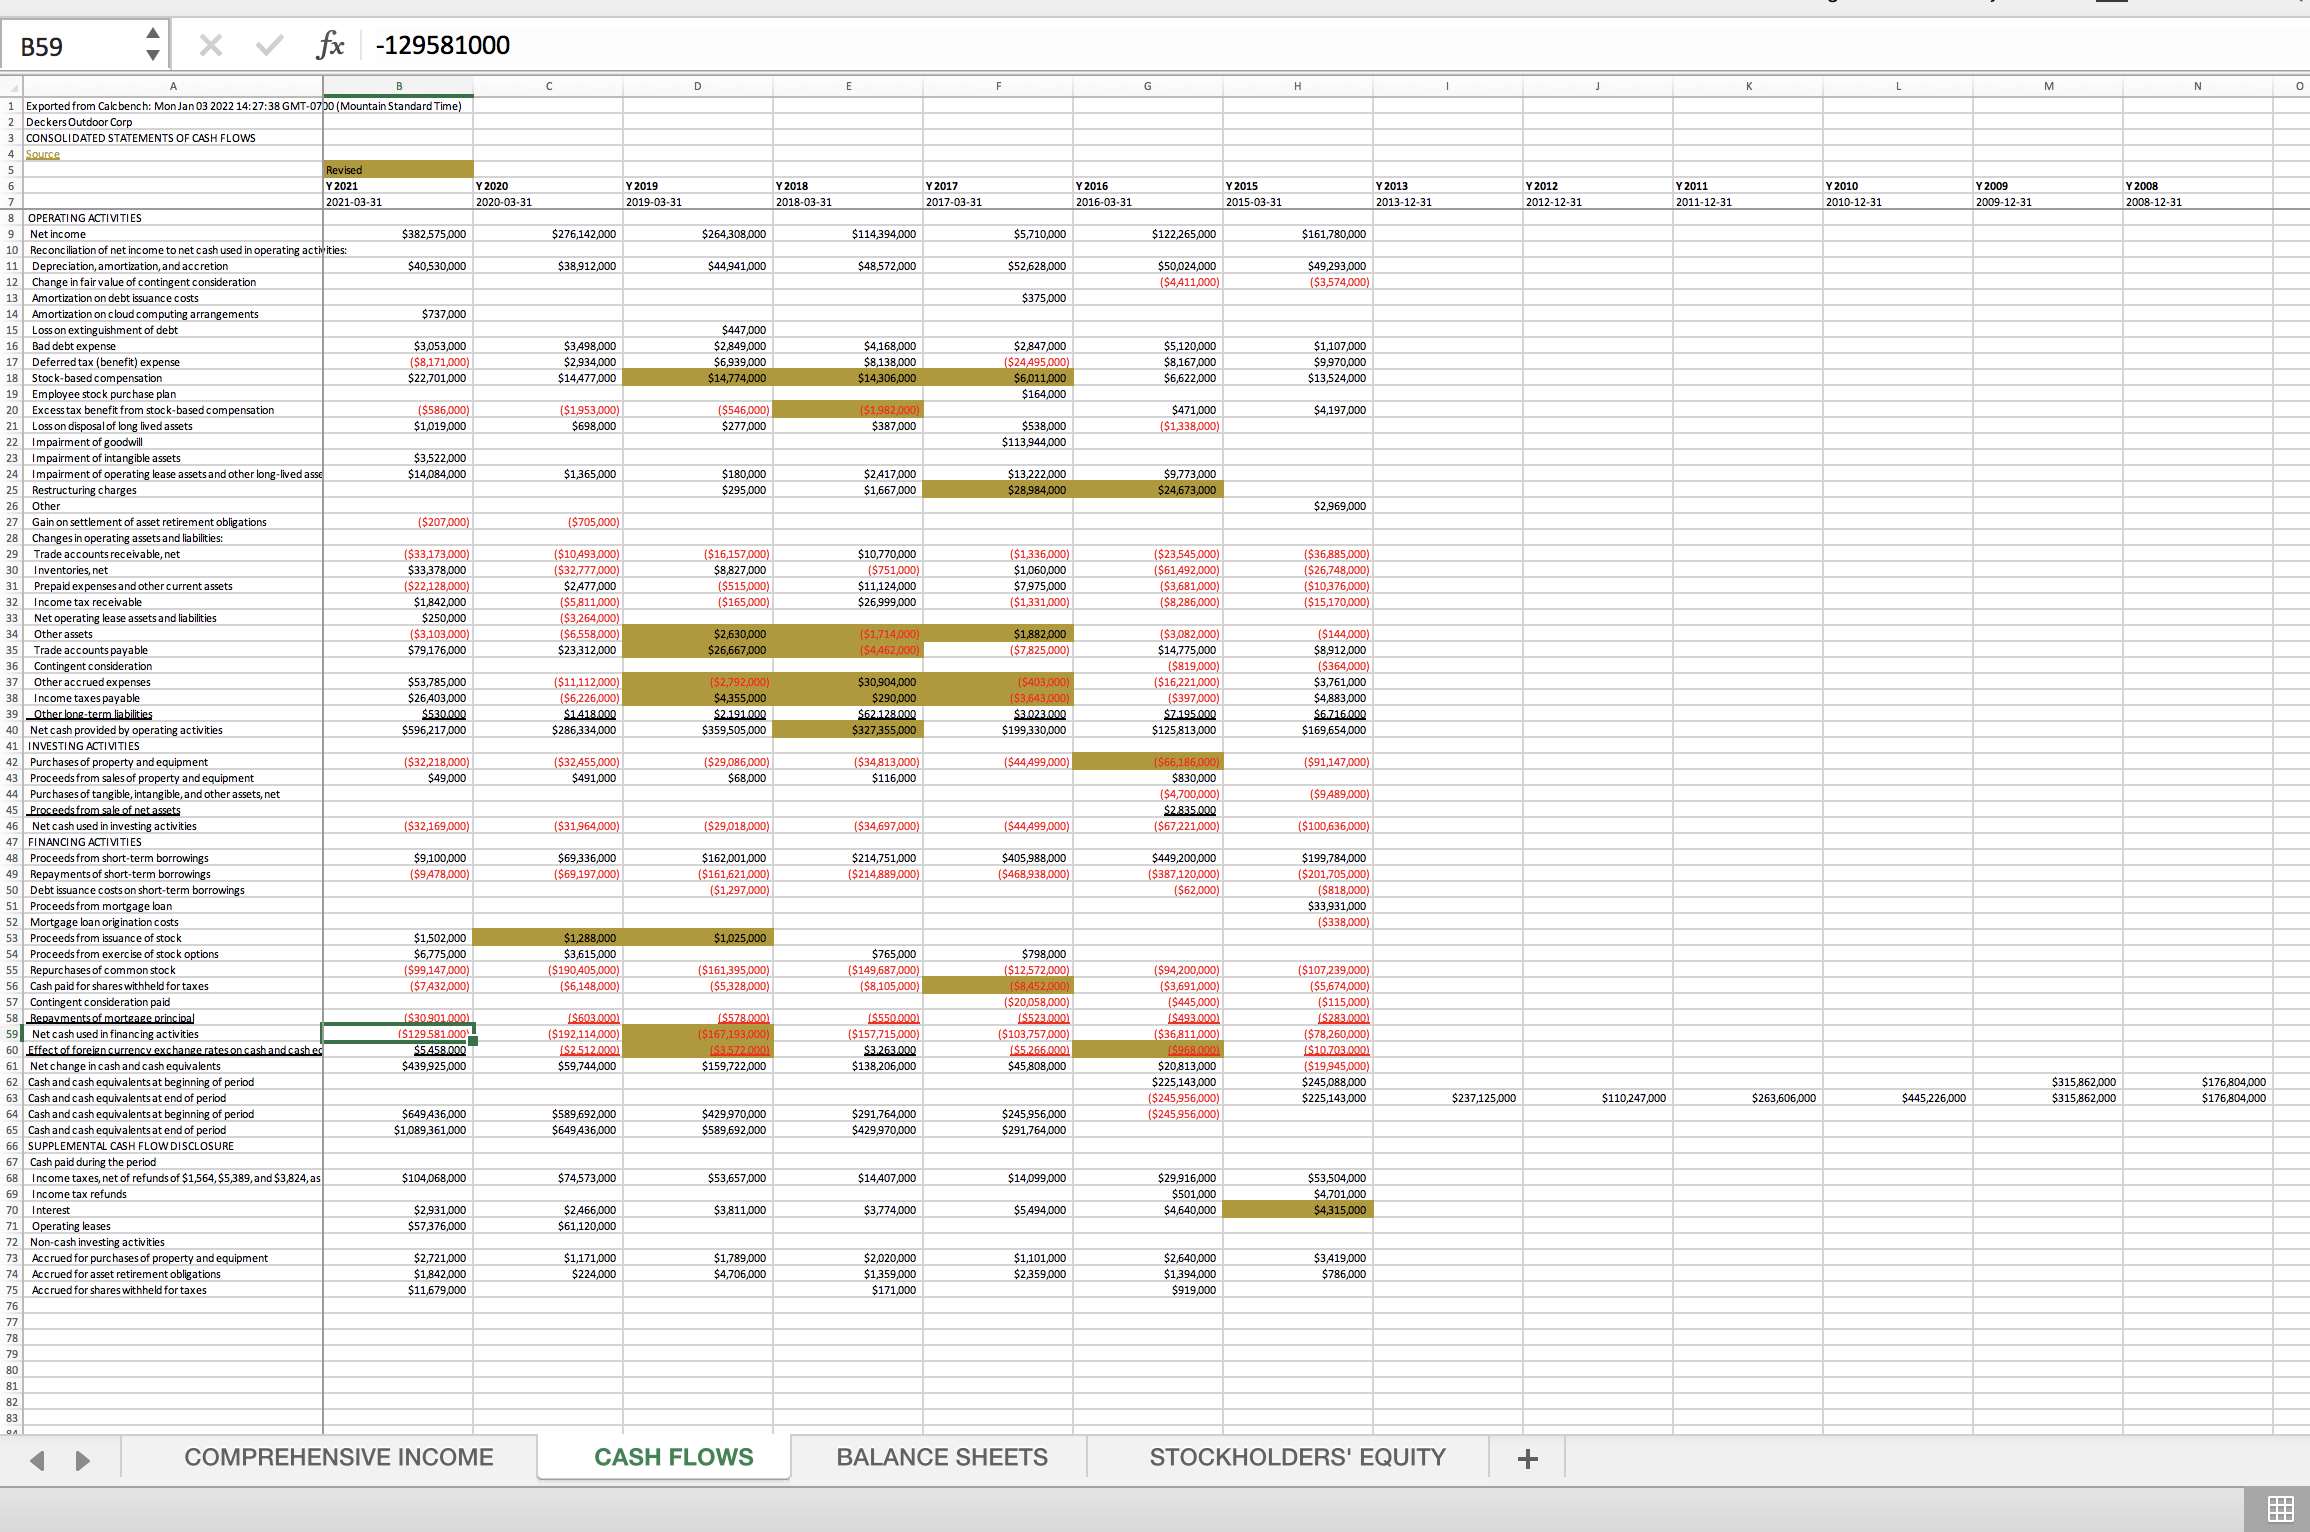
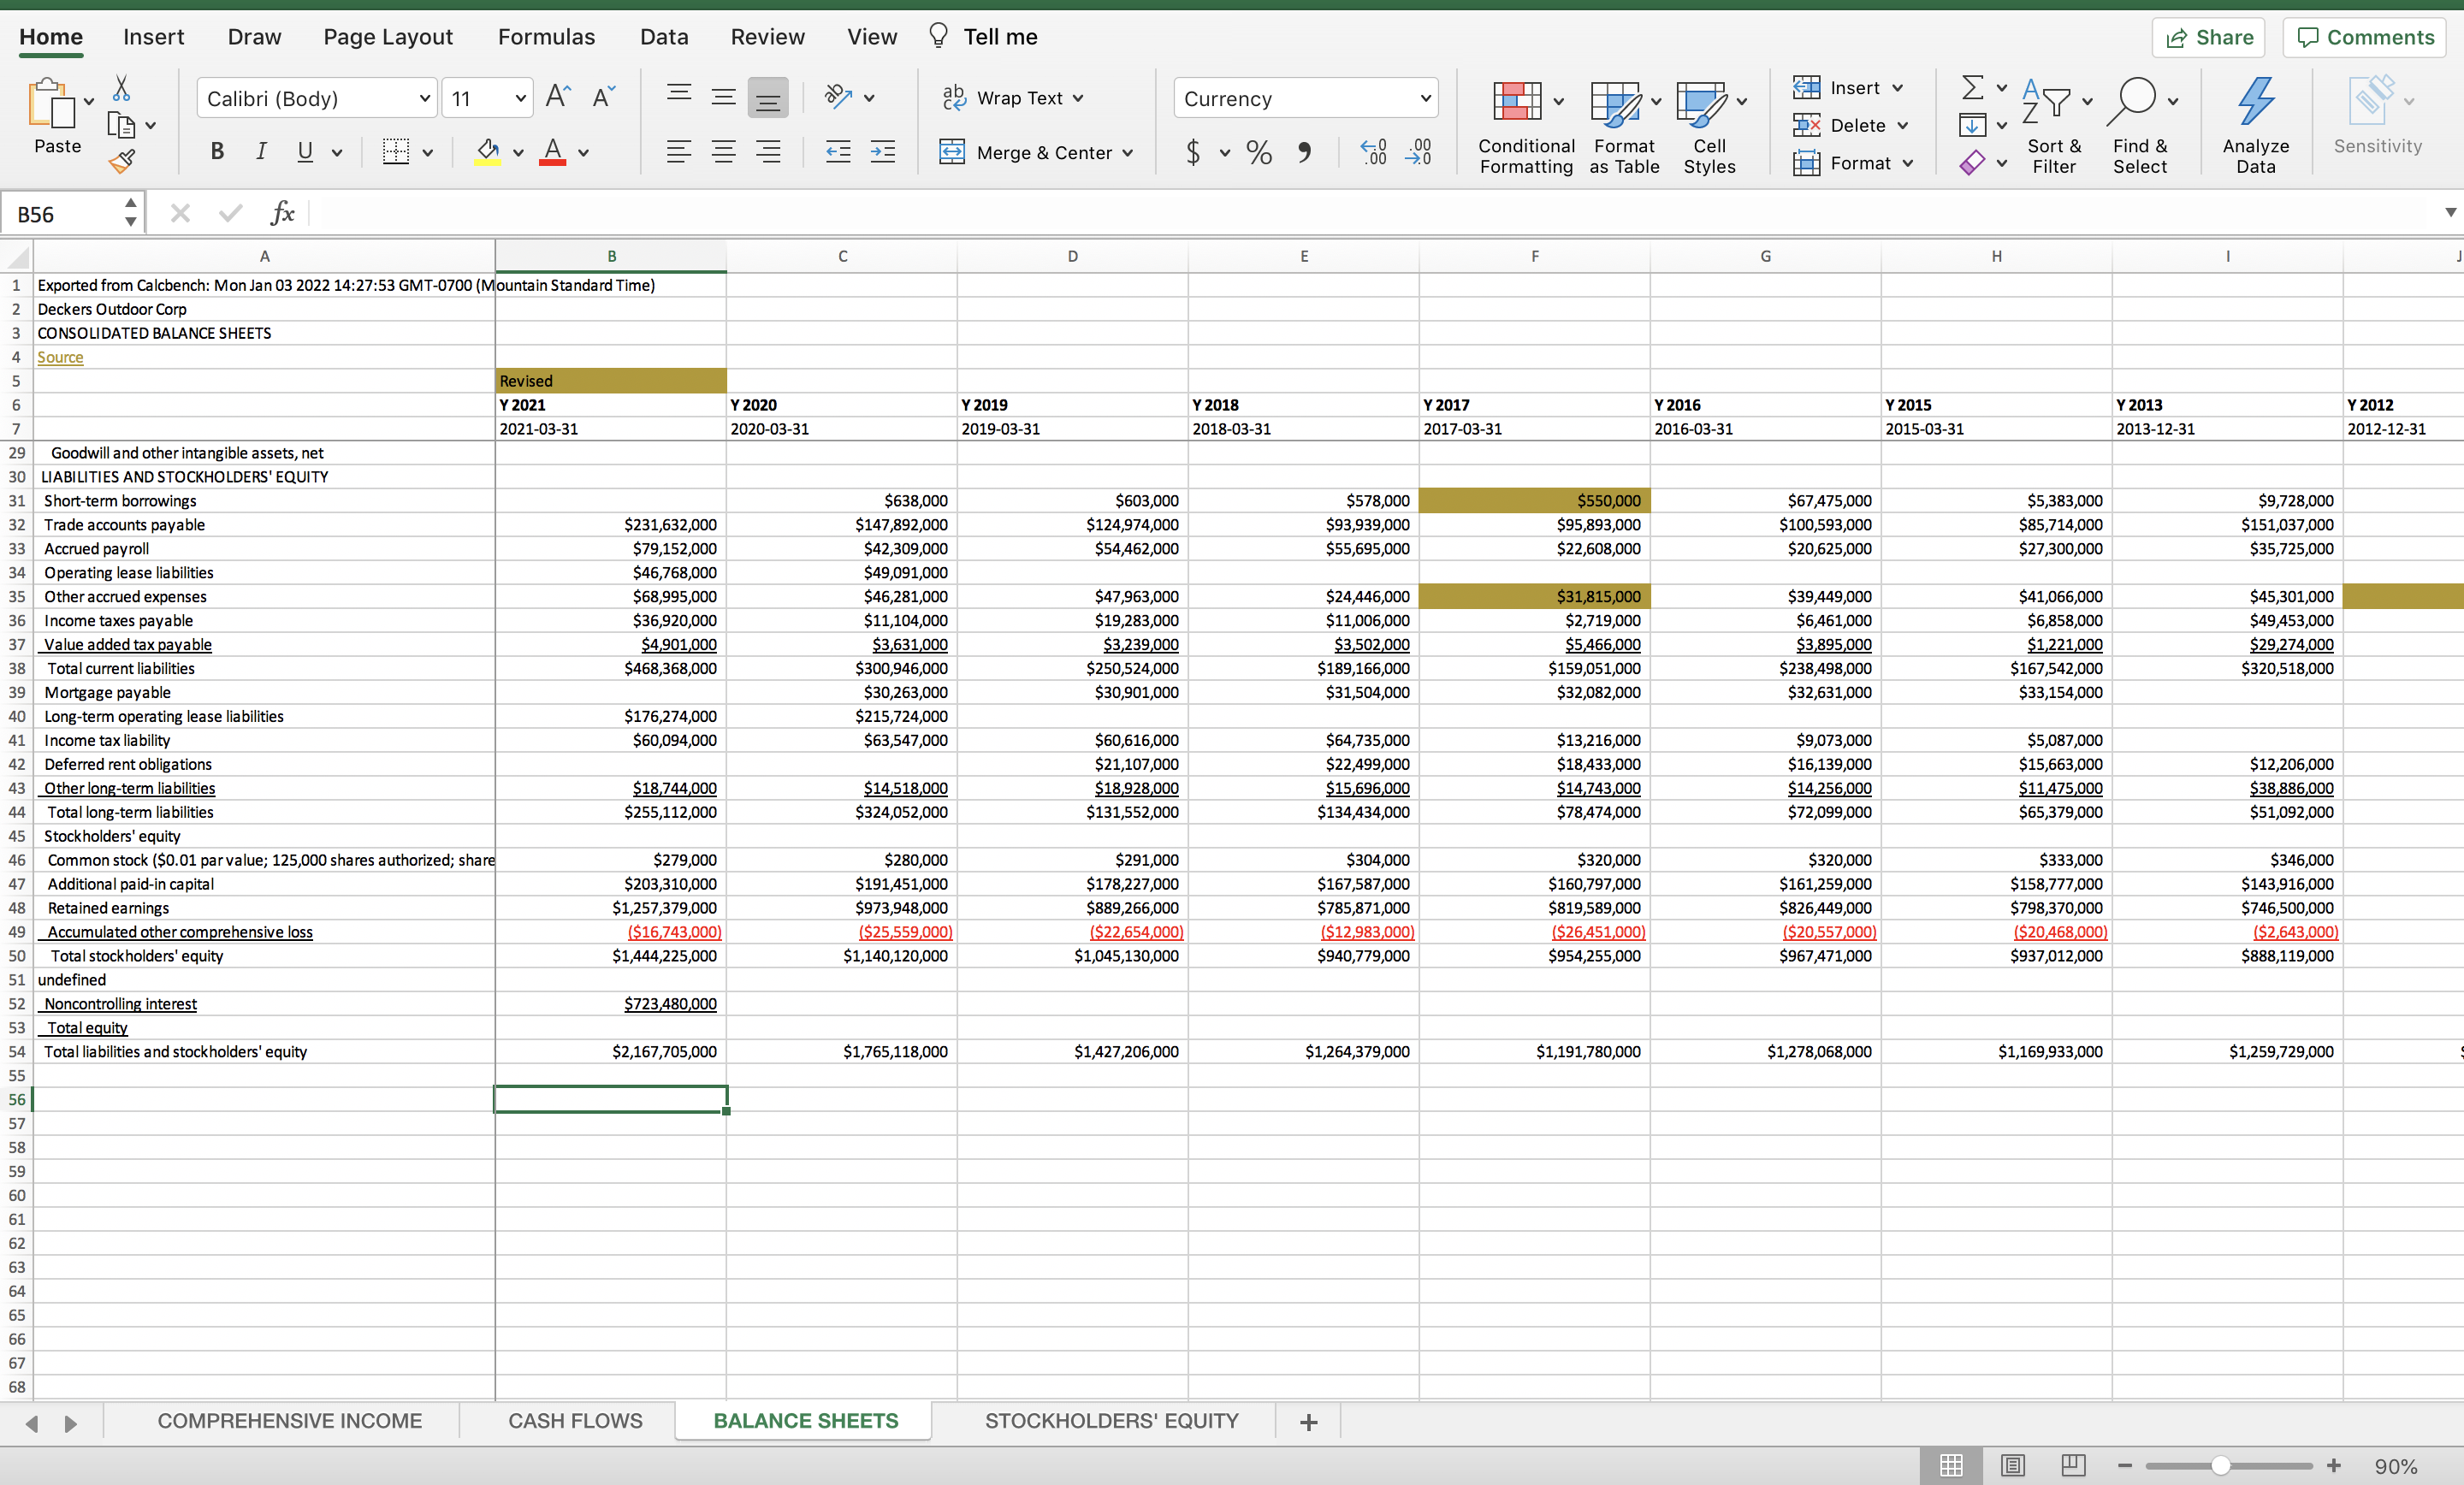
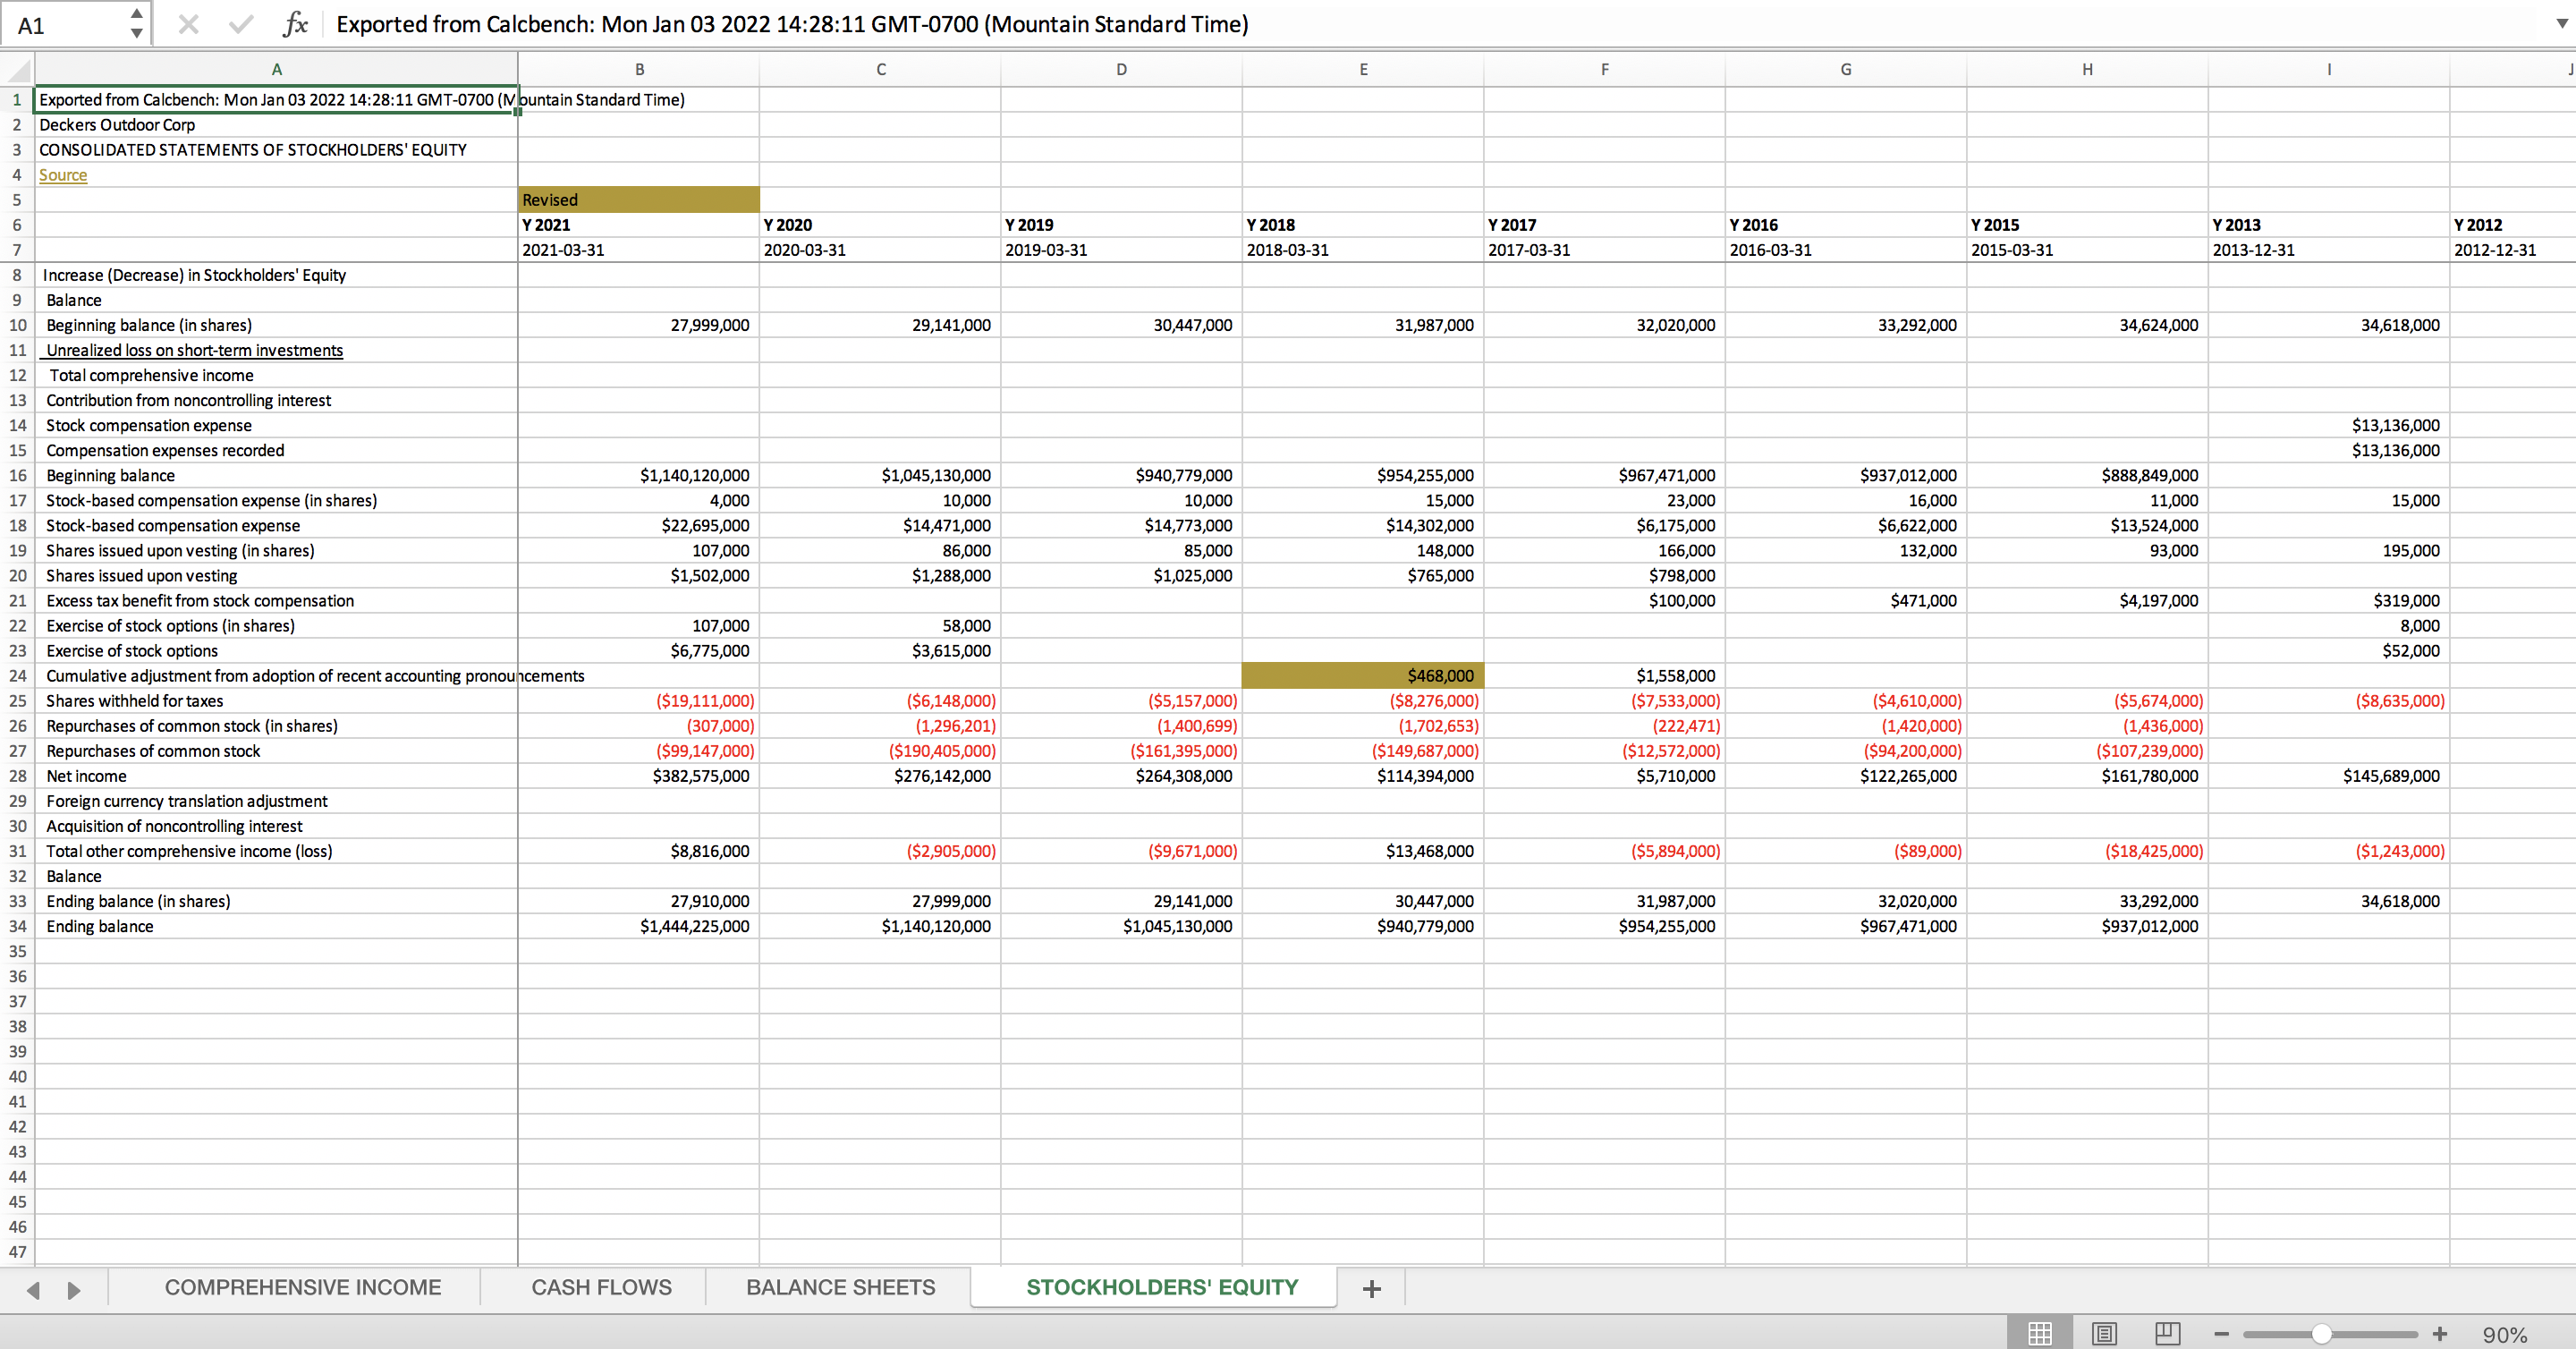
B14 X V fx =B10-B13 A B C D E F G H K 1 Exported from Calcbench: Mon Jan 03 2022 14:11:44 GMT-0700 (Mountain Standard Time) NIKE, Inc. Consolidated Statements of Income JOUDUNK Source Revised Y 2021 Y 2020 2019 Y 2018 Y 2017 Y 2016 Y 2015 Y 2014 Y 2013 Y 2012 2021-05-31 2020-05-31 2019-05-31 2018-05-31 2017-05-31 2016-05-31 2015-05-31 2014-05-31 2013-05-31 2012-05-31 8 Revenues $44,538,000,000 $37,403,000,000 $39,117,000,000 $36,397,000,000 $34,350,000,000 $32,376,000,000 $30,601,000,000 $27,799,000,000 $25,313,000,000 $23,331,000, 9 Cost of sales $24,576,000,000 $21,162,000,000 $21,643,000,000 $20,441,000,000 $19,038,000,000 $17,405,000,000 $16,534,000,000 $15,353,000,000 $14,279,000,000 $13,183,000, 10 Gross profit $19,962,000,000 $16,241,000,000 $17,474,000,000 $15,956,000,000 $15,312,000,000 $14,971,000,000 $14,067,000,000 $12,446,000,000 $11,034,000,000 $10,148,000, 11 Demand creation expense $3,114,000,000 $3,592,000,000 $3,753,000,000 $3,577,000,000 $3,341,000,000 $3,278,000,000 $3,213,000,000 $3,031,000,000 $2,745,000,000 $2,607,000, 12 Operating overhead expense $9,911,000,00 $9,534,000,000 $8,949,000,000 $7,934,000,000 $7,222,000,000 $7,191,000,000 $6,679,000,000 $5,735,000,000 $5,051,000,000 $4,472,000 13 Total selling and administrative expense $13,025,000,000 $13,126,000,000 $12,702,000,000 11,511,000,000 $10,563,000,000 $10,469,000,000 $9,892,000,000 $8,766,000,000 $7,796,000,000 $7,079,000, 14 Restructuring charges (Note 16) 6,937,000,000 15 Goodwill impairment (Note 4) 16 Intangible and other asset impairment (Note 4) 17 Interest expense (income), net $262,000,000 $89,000,000 $49,000,000 $54,000,000 $59,000,000 $19,000,00 $28,000,000 $33,000,00 ($3,000,000) $4,000 18 Other (income) expense, ne $14,000,000 $139,000,000 ($78,000,000 $66,000,000 ($196,000,000 ($140,000,000 ($58,000,000 $103,000,000 $15,000,000) $54,000, 19 Income before income taxes $6,661,000,000 $2,887,000,000 $4,801,000,000 $4,325,000,000 $4,886,000,000 $4,623,000,000 $4,205,000,000 $3,544,000,000 $3,256,000,000 $3,011,000 20 Income tax expense $934,000,000 $348,000,000 $772,000,000 $2,392,000,000 $646,000,000 $863,000,000 $932,000,000 $851,000,000 $805,000,000 $754,000, 21 NET INCOME FROM CONTINUING OPERATIONS $2,451,000,000 $2,257,000 22 NET INCOME FROM DISCONTINUED OPERATIONS $21,000,000 ($46,000, 23 NET INCOME $5,727,000,000 $2,539,000,000 $4,029,000,000 $1,933,000,000 $4,240,000,000 $3,760,000,000 $3,273,000,000 $2,693,000,000 $2,472,000,000 $2,211,000, 24 Earnings per common share: 25 Basic (in dollars per share) $3.64 $1.63 $2.55 $1.19 $2.56 $2.21 $1.90 $1.52 $2.74 26 Diluted (in dollars per share) $3.56 $1.60 $2.49 $1.17 $2.51 $2.16 $1.85 $1.49 $0.02 27 Dividends declared per common share (in dollars per share) $0.62 $0.54 50.47 $0.81 28 Weighted average common shares outstanding 29 Basic (in shares) 1,573,000,000 1,558,800,000 1,579,700,000 1,623,800,000 1,657,800,000 30 Diluted (in shares) 1,609,400,000 1,591,600,000 1,618,400,000 1,659,100,000 1,692,000,000 $2.68 31 Basic (Notes 1 and 12) (in dollars per share) $0.02 32 33 34 35 36 37 38 39 40 41 42 43 44 45 46 Income Balance Sheets Comprehensive Income Shareholders' Equity Cash Flows + - + 80%Name Box B C D E F G H K Exported from Calcbench: Mon Jan 03 2022 14:11:50 GMT-070 NIKE, Inc. Consolidated Balance Sheets total AR Revised Y 2021 2020 Y 2019 Y 2018 Y 2017 Y 2016 Y 2015 Y 2014 Y 2013 Y 2012 2021-05-31 2020-05-31 2019-05-31 2018-05-31 2017-05-31 2016-05-31 2015-05-31 2014-05-31 2013-05-31 2012-05-31 8 ASSETS 9 Current assets: 10 Cash and equivalents $9,889,000,000 ,000,00 $4,466,000,000 49,000,000 08,000,000 $3,138,000,0 52,000,000 20,000,000 $3,337,000,000 $2,254,000 11 Short-term investments $3,587,000,000 $439,000,000 $197,000,000 $996,000,000 $2,371,000,000 $2,319,000,000 $2,072,000,000 $2,922,000,000 $2,628,000,000 $1,440,000 12 Accounts receivable, net $4,463,000,000 $2,749,000,000 $4,272,000,000 $3,498,000,000 $3,677,000,000 $3,241,000,000 $3,358,000,000 $3,434,000,000 $3,117,000,000 $3,132,000, 13 Inventories $6,854,000,000 $7,367,000,000 $5,622,000,000 $5,261,000,000 $5,055,000,000 $4,838,000,000 $4,337,000,000 $3,947,000,000 $3,484,000,000 $3,222,000 14 Deferred income taxes (Note 9) $0.00 $355,000,000 $308,000,000 $262,000, 15 Prepaid expenses and other current assets $1,498,000,000 $1,653,000,000 $1,968,000,000 $1,130,000,000 $1,150,000,000 $1,489,000,000 $1,968,000,000 $818,000,000 $756,000,000 $857,000, 16 Assets of discontinued operations (Note 15) $615,000 17 Total current assets $26,291,000,000 $20,556,000,000 $16,525,000,000 $15,134,000,000 $16,061,000,000 $15,025,000,000 $15,587,000,000 $13,696,000,000 $13,630,000,000 $11,845,000 18 19 Property, plant and equipment, net $4,904,000,000 $4,866,000,000 $4,744,000,000 $4,454,000,000 $3,989,000,000 $3,520,000,000 $3,011,000,000 $2,834,000,000 $2,452,000,000 $2,209,000, 20 Operating lease rig $3,113,000,00 $3,097,000,00 21 Identifiable intangible assets, net $269,000,000 $274,000,00 $283,000,000 $285,000,000 $283,000,000 $281,000,000 $281,000,000 $282,000,000 $289,000,000 $370,000 22 Goodwill $242,000,000 $223,000,000 $154,000,000 $154,000,000 $139,000,000 $131,000,000 $131,000,000 $131,000,000 $131,000,000 $131,000 23 Deferred income taxes and other assets $2,921,000,000 $2,326,000,000 $2,011,000,000 $2,509,000,000 $2,787,000,000 $2,422,000,000 $2,587,000,000 $1,651,000,000 $1,043,000,000 $910,000 24 TOTAL ASSETS $37,740,000,000 $31,342,000,000 $23,717,000,000 $22,536,000,000 $23,259,000,000 $21,379,000,000 $21,597,000,000 $18,594,000,000 $17,545,000,000 $15,465,000, 25 LIABILITIES AND SHAREHOLDERS' EQUITY 26 Current liabilities: $511,000,000 27 Current portion of long-term debt $3,000,000 $6,000,000 $6,000,000 $6,000,000 $44,000,000 $107,000,000 $7,000,000 $57,000,000 $49,000, 28 Notes payable $2,000,000 $248,000,000 $9,000,000 $336,000,000 $325,000,000 $1,000,000 $74,000,000 $167,000,00 $98,000,000 $108,000, 29 Accounts payable $2,836,000,000 $2,248,000,000 $2,612,000,000 $2,279,000,000 $2,048,000,000 $2,191,000,000 $2,131,000,000 $1,930,000,000 $1,669,000,000 $1,549,000, 30 Current portion of operating lease liabilities $467,000,000 $445,000,000 31 Accrued liabilities $6,063,000,000 $5,184,000,000 $5,010,000,000 $3,269,000,000 $3,011,000,000 $3,037,000,000 $3,949,000,000 $2,491,000,000 $2,036,000,000 $1,941,000 32 Income taxes payable $306,000,000 $156,000,000 $229,000,000 $150,000,000 $84,000,000 $85,000,00 $71,000,000 $432,000,000 $84,000,000 $65,000 33 Liabilities of discontinued operations (Note 15) $18,000,000 $170,000, 34 Total current liabilities $9,674,000,000 $8,284,000,000 $7,866,000,000 $6,040,000,000 $5,474,000,000 $5,358,000,000 $6,332,000,000 $5,027,000,000 $3,962,000,000 $3,882,000, 35 Long-term deb $9,413,000,000 $9,406,000,000 $3,464,000,000 $3,468,000,000 $3,471,000,000 $1,993,000,000 $1,079,000,000 $1,199,000,000 $1,210,000,000 $228,000, 36 Operating lease liabilities $2,931,000,000 $2,913,000,000 37 Deferred income taxes and other liabilities $2,955,000,000 $2,684,000,000 $3,347,000,000 $3,216,000,000 $1,907,000,000 $1,770,000,000 $1,479,000,000 $1,544,000,000 $1,292,000,000 $974,000, 38 Commitments and contingencies (Note 18) $24,973,000,000 39 Redeemable preferred stock $24,973,000,000 40 Shareholders' equity: 41 Common stock at stated value S 3,000,000 $3,000,000 $3,000,000 $3,000,000 $3,000,000 $3,000,000 $3,000,000 $3,000,000 $3,000,000 $3,000, 42 Capital in excess of stated value $9,965,000,000 $8,299,000,00 $7,163,000,00 $6,384,000,00 $5,710,000,000 $7,786,000,00 $6,773,000,00 $5,865,000,000 $5,184,000,000 $4,641,000, 43 Accumulated other comprehensive income (loss) ($380,000,000) ($56,000,000) $231,000,000 ($92,000,000) ($213,000,000) $318,000,000 $1,246,000,00 $85,000,000 $274,000,000 $149,000 44 Retained earnings (deficit) $3,179,000,000 ($191,000,000) $1,643,000,000 $3,517,000,000 $6,907,000,000 $4,151,000,000 $4,685,000,000 $4,871,000,000 $5,620,000,000 $5,588,000 45 Total shareholders' equity $12,767,000,000 $8,055,000,000 $9,040,000,000 $9,812,000,000 $12,407,000,000 $12,258,000,000 $12,707,000,000 $10,824,000,000 $11,081,000,000 $10,319,000 46 undefine 47 TOTAL LIABILITIES AND SHAREHOLDERS' EQUITY $37,740,000,000 $31,342,000,000 $23,717,000,000 $22,536,000,000 $23,259,000,000 $21,379,000,000 $21,597,000,000 $18,594,000,000 $17,545,000,000 $15,465,000, 48 49 50 51 52 Income Balance Sheets Comprehensive Income Shareholders' Equity Cash Flows +A1 X V fx Exported from Calcbench: Mon Jan 03 2022 14:12:04 GMT-0700 (Mountain Standard Time) A D G H Exported from Calcbench: Mon Jan 03 2022 14:12:04 GMT-070) (Mountain Standard Time) NIKE, Inc. n D WN Consolidated Statements of Shareholders' Equity Source Revised Y 2021 Y 2020 Y 2019 Y 2018 Y 2017 Y 2016 Y 2015 Y 2014 Y 2013 Y 2012 2021-05-31 2020-05-31 2019-05-31 2018-05-31 2017-05-31 2016-05-31 2015-05-31 2014-05-31 2013-05-31 2012-05-31 8 Beginning Balance (in shares) 1,558,000,000 568,000,000 601,000,000 1,643,000,000 1,682,000,000 1,712,000,000 1,740,000,00 1,789,000,000 916,000,000 936,000, 9 Beginning balance $8,055,000,000 $9,040,000,000 $9,812,000,000 $12,407,000,000 $12,258,000,000 $12,707,000,000 $10,824,000,00 $11,081,000,000 $10,319,000,000 $9,793,000 10 Stock options exercised (in shares) 21,000,000 20,000,000 18,000,000 24,000,000 17,000,000 22,000,000 27,000,000 22,000,000 10,000,000 18,000 11 Stock options exercised $954,000,000 $703,000,000 $539,000,00 $600,000,000 $525,000,000 $680,000,000 $639,000,000 $445,000,000 $322,000,000 $528,000 12 Conversion to Class B Common Stock (in shares) | Class A Com 10,000,000 14,000,000 24,000,000 2,000,000) 1,000,000) 13 Conversion to Class B Common Stock (in shares) | Class B Com 10,000,000 14,000,000 24,000,000 2,000,000 ,000,000 14 Conversion of Stock, Shares Issued 2,000,000 15 Conversion to Class B Common Stock 40,000, 16 Repurchase of Class B Common Stock (in shares) (5,000,000 (34,000,000 (54,000,000 (70,000,000 (60,000,000 (55,000,000 (58,000,000) (34,000,000 17 Repurchase of Class B Common Stock ($650,000,000 ($3,033,000,000) ($4,283,000,000 ($4,267,000,000) $3,249,000,000 ($3,238,000,000 $2,534,000,000 ($2,628,000,000) ($1,657,000,000 18 Dividends on common stock and preferred stock ($1,692,000,000 ($1,491,000,000) $1,360,000,000) ($1,265,000,000) $1,159,000,000 ($1,053,000,000) ($931,000,000 ($821,000,000) ($727,000,000) ($639,000, 19 Issuance of shares to employees, net of shares withheld for emp 4,000,000 4,000,000 3,000,000 4,000,000 4,000,000 3,000,000 3,000,000 3,000,000 2,000,000 2,000, 20 Issuance of shares to employees, net of shares withheld for emp $86,000,000 $156,000,000 $139,000,000 $82,000,000 $108,000,000 $94,000,000 $84,000,000 $78,000,000 $65,000,000 $57,000 21 Stock-based compensation $611,000,000 $429,000,000 $325,000,000 $218,000,000 $215,000,000 $236,000,000 $191,000,000 $177,000,000 $174,000,000 $130,000, 22 Forfeiture of shares from employees (in shares) (1,000,000) Forfeiture of shares from employees ($12,000,000) ($12,000,000) ($10,000, 24 Net income $5,727,000,000 $2,539,000,000 $4,029,000,000 $1,933,000,000 $4,240,000,000 $3,760,000,000 $3,273,000,000 $2,693,000,000 $2,472,000,000 $2,211,000, 25 Foreign currency translation and other (net of tax benefit of $72 in 2010 and tax expense of $121 in 2011 and net of $0 tax in 2012) 26 Realized foreign currency translation gain due to divestiture (Note 17) 27 Net gain (loss) on cash flow hedges (net of tax expense of $28 in 2010 and tax benefit of $66 in 2011 and net of tax expense of $8 in 2012 ) 28 Net gain (loss) on net investment hedges (net of tax expense of $21 in 2010 and tax benefit of $28 in 2011 and net of $0 tax in 2012) 29 Reclassification to net income of previously deferred net gains related to hedge derivatives (net of tax expense of $42 in 2010, $24 in 2011 and net of tax benefit of $14 in 2012) 30 Reclassification of ineffective hedge gains to net income (net of tax expense of $1) 31 Other comprehensive income (loss) ($324,000,000) ($287,000,000) $323,000,000 $104,000,000 ($531,000,000) ($928,000,000) $1,161,000,000 ($189,000,000) $125,000,000 $54,000 Adoption of FIN 48 (Note 1 and 9) Adoption of EITF 06-2 Sabbaticals (net of tax benefit of $6.2) 34 Ending Balance (in shares) 35 Ending Balance (in shares) 1,578,000,000 1,558,000,000 1,568,000,000 1,601,000,000 1,643,000,000 1,682,000,000 1,712,000,000 3,480,000,000 1,789,000,000 916,000 36 Ending balance $12,767,000,000 $8,055,000,000 $9,040,000,000 $9,812,000,000 $12,407,000,000 $12,258,000,000 $12,707,000,000 $10,824,000,000 $11,081,000,000 $10,319,00 37 38 39 40 41 42 43 44 45 55 D Income Balance Sheets Comprehensive Income Shareholders' Equity Cash Flows + + 80%B C D E F G H K Exported from Calcbench: Mon Jan 03 2022 14:12:13 GMT-0700 (Mountain Standard Time) NIKE, Inc. Consolidated Statements of Cash Flows Source Revised Y 2021 Y 2020 Y 2019 Y 2018 Y 2017 Y 2016 Y 2015 Y 2014 Y 2013 Y 2012 2021-05-31 2020-05-31 2019-05-31 2018-05-31 2017-05-31 2016-05-31 2015-05-31 2014-05-31 2013-05-31 2012-05-31 26 Purchases of short-term investments ($9,961,000,000) ($2,426,000,000) ($2,937,000,000) ($4,783,000,000) ($5,928,000,000) ($5,367,000,000) ($4,936,000,000) ($5,386,000,000) ($3,245,000 27 Maturities and sales of short-term investments 28 Maturities of short-term investments $4,236,000,000 $74,000,000 $1,715,000,000 $3,613,000,000 $3,623,000,000 $2,924,000,000 $3,655,000,000 $3,932,000,000 $1,663,000,000 $2,663,000, 29 Sales of short-term investments $2,449,000,000 $2,379,000,000 $2,072,000,000 $2,496,000,000 $2,423,000,000 $2,386,000,000 $2,216,000,000 $1,126,000,000 $1,330,000,000 $1,721,000, 30 Investments in reverse repurchase agreements $150,000,000 $150,000,000) 31 Additions to property, plant and equipment ($695,000,000) ($1,086,000,000) ($1,119,000,000) ($1,028,000,000) ($1,105,000,000) ($1,143,000,000) ($963,000,000) ($880,000,000) $563,000 32 Disposals of property, plant and equipment $13,000,000 $10,000,000 $3,000,000 $3,000,000 $14,000,000 $2,000 33 Proceeds from divestitures $786,000,000 34 Other investing activities $171,000,000 $31,000,000 $5,000,000 ($34,000,000) $6,000,000 ($2,000,000) 35 Settlement of net investment hedges $22,000 36 Acquisition of subsidiary, net of cash acquired (Note 4) 37 Cash provided (used) by investing activities ($3,800,000,000) 028,000,000) ($264,000,000) $276,000,000 ($1,008,000,000) ($1,034,000,000) ($175,000,000) ($1,207,000,000) ($940,000,000) $586,000, 38 Cash provided (used) by financing activities 39 Proceeds from borrowings, net of debt issuance costs $6,134,000,000 $1,482,000,000 $981,000,000 $986,000,000 40 Long-term debt payments, including current portion $44,000,000 ($106,000,000) ($7,000,000) ($60,000,000 ($49,000,000 ($203,000, 41 Increase (decrease) in notes payable, net ($52,000,000) $49,000,000 ($325,000,000) $13,000,000 327,000,000 ($67,000,000) $63,000,000) $75,000,000 $10,000,000 ($47,000 42 Payments on capital lease and other financing obligations ($17,000,000) ($7,000,000) ($19,000,000) ($17,000,000) Repayment of borrowings ($197,000,000) ($6,000,000) ($6,000,000) 44 Proceeds from exercise of stock options and other stock issuan $1,172,000,000 $885,000,000 $700,000,000 $733,000,000 $489,000,000 $507,000,000 $514,000,00 $383,000,000 $313,000,000 $468,000, 45 Excess tax benefits from share-based payment arrangements $218,000,000 $132,000,000 $72,000,000 $115,000, 46 Repurchase of common stock ($608,000,000 ($3,067,000,000 $4,286,000,000 ($4,254,000,000) ($3,223,000,000) ($3,238,000,000) ($2,534,000,000) ($2,628,000,000) ($1,674,000,000) ($1,814,000, 47 Dividends - common and preferred ($1,638,000,000) $1,452,000,000) $1,332,000,000) ($1,243,000,000) $1,133,000,000) $1,022,000,000) ($899,000,000) ($799,000,000) ($703,000,000) ($619,000, 48 Tax payments for net share settlement of equity awards ($29,000,000) ($22,000,000) 49 Other financing activities ($136,000,000) ($84,000,000) 50 Cash provided (used) by financing activities $1,459,000,000) $2,491,000,000 $5,293,000,000) $4,835,000,000) ($2,790,000,000) ($2,914,000,000) ($1,045,000,000) ($2,100,00 51 Effect of exchange rate changes on cash and equivalents $143,000,000 ($66,000,000) ($129,000,000) $45,000,000 ($20,000,000) $105,000,000) ($83,000,000) $36,000,000 ($41,00 52 Net increase (decrease) in cash and equivalents $1,541,000,000 $3,882,000,000 $217,000,000 $441,000,000 $670,000,000 ($714,000,000) $1,632,000,000 $1,117,000,000) $1,083,000,000 $377,000 53 Cash and equivalents, beginning of year $3,808,000,000 3,138,000,000 $3,852,000,000 $2,220,000,000 $3,337,000,000 $2,254,000,000 $1,877,000 54 CASH AND EQUIVALENTS, END OF YEAR $4,249,000,000) $3,808,000,000 $3,138,000,000 $3,852,000,000 $2,220,000,000 $3,337,000,000 $2,254,000 55 Cash and equivalents, beginning of year $8,348,000,000 $4,466,000,000 $4,249,000,000 ($4,249,000,000) 56 CASH AND EQUIVALENTS, END OF YEAR $9,889,000,000 $8,348,000,000 $4,466,000,000 57 Supplemental disclosure of cash flow information: $1,541,000,000 58 Cash paid during the year for: 59 Interest, net of capitalized interest $293,000,000 $140,000,000 $153,000,000 $125,000,000 $98,000,000 $70,000,000 $53,000,000 $53,000,000 $20,000,000 $29,000, 60 Income taxes 1,177,000,000 $1,028,000,000 $757,000,000 $529,000,000 $703,000,000 $748,000,000 $1,262,000,000 $856,000,000 $702,000,000 $638,000, 61 Non-cash additions to property, plant and equipment $179,000,000 $121,000,000 $160,000,000 $294,000,000 $266,000,000 $252,000,000 $206,000,000 $167,000,000 $137,000,000 $99,000, 62 Dividends declared and not paid $438,000,000 $385,000,000 $347,000,000 $320,000,000 $300,000,000 $271,000,000 $240,000,000 $209,000,000 $188,000,000 $165,000 63 64 65 66 67 68 69 70 Income Balance Sheets Comprehensive Income Shareholders' Equity Cash Flows +Find Nike '5 Form 10~K for 2021, for the fiscal year ended May 31, 2021 (nikecom) by scrolling to the bottom and click on Investors under ABOUT NIKE. From the Investors page (investors.nike.com), hover over Investors in the upper left, then click on Annual Reports to find 10k PDF). Briey answer the following questions using the information provided. Complete sentences are not required except where specifically noted. Unless otherwise noted, the relevant information is contained in Item 8,\"Financial Statements and Supplementary Data,\" which begins on page 53. Also, unless otherwise noted, the questions relate to fiscal year 2021. Statement of Cash Flows 24. What was the net change in Nike's cash and cash equivalents during the year? 25. How much did Nike pay in cash dividends during the year? 26. What is Nike's net cash from operating activities? 27. What is Nike '3 net cash from investing activities? 28. What is Nike 's net cash from nancing activities? Comparison of Nike and Deckers Outdoor Corporation 29. Which company had higher percentage sales growth from 2020 to 2021? 30. Which company had more protable sales? Calculate the two company's gross prot margins. 31. Which company had a higher income tax rate? Calculate the difference in effective tax rates (i.e., income tax expense , pretax income). 32. Which company has more nancial risk? Calculate the difference in debt-to-equity ratios (i.e., total debt , total equity). 3. Additional Analysis 33. Which geographical operating segment experienced the highest percentage revenue growth during 2021 (compared to 2020)? What was that operating segment 's percentage revenue growth? 34. Which geographical operating segment experienced the highest percentage growth rate in earnings before taxes? What was that operating segment's percentage growth in earnings before taxes? (Note 1?, Page 89). 35. Which two operating segments have the greatest amount of Property, Plant and Equipment? (Note 17, Page 90) 36. What additional trademarks operate under Converse? (Note 1, Page 63) B39 X V fx A B C D E F G H Exported from Calcbench: Mon Jan 03 2022 14:27:19 GMT-0700 (Mountain Standard Time) Deckers Outdoor Corp CONSOLIDATED STATEMENTS OF COMPREHENSIVE INCOME Source Y 2021 Y 2020 Y 2019 Y 2018 Y 2017 Y 2016 Y 2015 Y 2013 Y 2012 2021-03-31 2020-03-31 2019-03-31 2018-03-31 2017-03-31 2016-03-31 2015-03-31 2013-12-31 2012-12-31 8 Net sales $2,545,641,000 $2,132,689,000 $2,020,437,000 $1,903,339,000 $1,790,147,000 $1,875,197,000 $1,817,057,000 $1,556,618,000 9 Cost of sales $1,171,551,000 $1,029,016,000 $980,187,000 $971,697,000 $954,912,000 $1,028,529,000 $938,949,000 $820,135,000 10 Gross profit $1,374,090,000 $1,103,673,000 $1,040,250,000 $931,642,000 $835,235,000 $846,668,000 $878,108,000 $736,483,000 11 Selling, general, and administrative expenses $869,885,000 $765,538,000 $712,930,000 $709,058,000 $837,154,000 $684,541,000 $653,689,000 $528,586,000 12 Income from operations $504,205,000 $338,135,000 $327,320,000 $222,584,000 $1,919,000) $162,127,000 $224,419,000 $207,897,000 13 Interest income ($2,637,000) ($7,261,000 ($6,028,000) ($3,057,000) ($778,000) ($420,000) ($207,000) ($60,000 14 Interest expense $6,028,000 $5,046,000 $4,661,000 $4,585,000 $7,319,000 $5,814,000 $4,220,000 $3,079,000 15 Other income, net $700,000) ($516,000 ($247,000) $360,000 $1,474,000) ($152,000) ($733,000) ($679,000) 16 Total other expense (income), net $2,691,000 ($2,731,000 ($1,614,000) $1,888,000 $5,067,000 $5,242,000 $3,280,000 $2,340,000 Income before income taxes $501,514,000 $340,866,000 $328,934,000 $220,696,000 ($6,986,000) $156,885,000 $221,139,000 $205,557,000 18 Income tax expense $118,939,000 $64,724,000 $64,626,000 $106,302,000 ($12,696,000) $34,620,000 $59,359,000 $59,868,000 19 Net income 20 Net income $382,575,000 $276,142,000 $264,308,000 $114,394,000 $5,710,000 $122,265,000 $161,780,000 $145,689,000 21 Noncontrolling interest 22 Other comprehensive income (loss) 23 Unrealized loss on cash flow hedges, net of tax $461,000 $450,000 ($486,000) 24 Unrealized loss on cash flow hedges, net of tax ($243,000) ($613,000 $704,000 25 Foreign currency translation gain (loss) $8,816,000 ($2,905,000 $9,428,000) $14,081,000 ($6,598,000) ($550,000) ($18,875,000) ($757,000) 26 Total other comprehensive income (loss) $8,816,000 $2,905,000) ($9,671,000) $13,468,000 ($5,894,000) ($89,000) $18,425,000) ($1,243,000) 27 Comprehensive income 28 Comprehensive income $391,391,000 $273,237,000 $254,637,000 $127,862,000 ($184,000) $122,176,000 $143,355,000 $144,446,000 29 Noncontrolling interest 30 Net income per share 31 Basic (in dollars per share) $13.64 $9.73 $8.92 $3.60 $0.18 $3.76 $4.70 $4.23 32 Diluted (in dollars per share) $13.47 $9.62 $8.84 $3.58 SO.1 $3.70 $4.66 $4.18 3 Weighted-average common shares outstanding 34 Basic (in shares) 28,055,000 28,385,000 29,641,000 31,758,000 32,000,000 32,556,000 34,433,000 34,473,000 35 Diluted (in shares) 28,406,000 28,694,000 29,903,000 31,996,000 32,355,000 33,039,000 34,733,000 34,829,000 36 Impairment loss on intangible assets 37 38 39 40 41 42 43 44 45 46 47 COMPREHENSIVE INCOME CASH FLOWS BALANCE SHEETS STOCKHOLDERS' EQUITY + + 90%B59 X V fx -129581000 Exported from Calcbench: Mon Jan 03 2022 14:27:38 GMT-0700 (Mountain Standard Time) 2 Deckers Outdoor Corp 3 CONSOLIDATED STATEMENTS OF CASH FLOWS 4 Source 5 Revised 6 Y 2021 Y 2020 Y 2019 Y 2018 2021-03-31 Y 2017 2020-03-31 019-03-31 Y 2016 Y 2015 Y 2013 2017-03-31 Y 2012 Y 2011 2016-03-31 Y 2010 OPERATING ACTIVITIES 018-03-31 015-03-3 2013-12-31 Y 2009 2012-12-31 Y 2008 011-12-31 Net income 2010-12-31 $382,575,000 2009-12-31 008-12-31 10 Re 276,142,000 Reconciliation of net income to net cash used in operating activities: $264,308,000 $114,394,000 $5,710,000 $122,265,000 $161,780,000 Depreciation, amortiza and accretion $40,530,000 $38,912,000 Change in fair value of contingent consideration $44,941,000 $48,572,000 $52,628,000 $50,024,00 $49,293,000 Amortization on debt issuance costs ($4 411,000 ($3,574,000) ization on cloud computing arrangements $737,000 $375,000 Loss on extinguishme $447,000 Bad debt expense $3,053,000 $3,498,000 2,849,00 Deferred tax (benefit) expense ;4,168,00 $8,171,000) $2,847,000 $5,120,000 $6,939,000 Stock-based compensation $2,934,000 8,138,00 $1,107,00 22,701,000 14 477,000 $8,167,000 19 E 14,774,000 ;14,306,0 Employee stock purchase plan $6,011,000 $6,622,000 $9,970,000 13,524,000 20 E Excess tax benefit from stock-based compensation ($586,000) ($1,953,000) ($546,000) $164,000 if disposal of long lived assets $1,019,000 $698,000 $471,000 $387,000 $538,000 $4,197,000 Impairment of goodwill $277,000 ($1,338,000) Impairment of intangible assets $3,522,000 113,944,000 24 1 au pairment of operating lease assets and other long-lived asse $14,084,000 kestructuring charges $1,365,000 $180,000 $2417,000 $13,222,000 Other 295,000 1,667,00 28,984,000 $9,773,000 24,673,000 Gain on settlement of asset retirement obligations ($207,000) ($705,000) $2,969,000 Changes in operating assets and liabilities: Trade accounts receivable, net ($33,173,000) Inventories, net ($16,157,000 $10,770,000 $33,378,000 $32,777,000) ($23,545,000) Prepaid expenses and other current assets $8,827,000 $22,128,000 ($751,00 $1,060,000 ($36,885,000) $2477,000 ($61 492,000) ($515,000 Income tax receivable $1,842,000 $11,124,00 ($26,748,000) $7,975,000 ($3,681,000) $5,811,000) ($165,000) $10,376,000) Net operating lease assets and liabilities ($3,264,000) $26,999,00 ($1,331,000) ($8,286,000) $15,170,000) Other assets 3,103,000) ($6,558,000) $2,630,000 Trade accounts payable 79,176,000 23,312,000 $1,882,000 $26,667,000 ($3,082,000) ($144,000) 36 Contingent consideration ($7,825,000) $14,775,000 8,912,000 Other accrued expenses $53,785,000 $11,112,000) $30,904,000 ($819,080) ($364,000) 39 Income taxes payable $26 403,000 ($6,226,000) $4,355,000 $290,000 $16,221,000) $3,761,000 $530.000 $1418 000 $62.128,000 ($397,000) $4,883,000 0 Net cash provided by operating activities $3.023.000 SZ.195,000 41 INVESTING ACTIVITIES 596,217,000 286,334,000 $359,505,000 $6.716.000 199,330,000 125,813,000 $169,654,000 ases of property and equipment ($32,218,000) ($32 455,000) ($29,086,000) ($34,813,000) as from sales of property and equipment $49,000 $491,000 ($44 499,000) $68,000 $116,00 ($91,147,000) ses of tangible, intangible, and other assets, net n sale of net assets $4,700,000 ($9 489,000) cash used in investing activitie ($32,169,000) $2.835,00 ($31,964,000) LANCING ACTIVITIES ($29 018,000) ($34,697,000) ($44 499,000) $67,221,000 ($100,636,000) sfrom short-term borrowings $9,100,000 $69,336,000 $162,001,000 $214,751,000 $405,988,000 $449,200,000 50 D ents of short-term borrowings ($9 478,000 ($69,197,000) ($161,621,000) ($214,889,000) $199,784,000 dance costs on short-term borrowings ($1,297,000) $468,938,000) $387,120,000 $201,705,000 ($62,000) ($818,000 ination costs 33,931,00 suance of stock $1,502,000 $1, 288,000 ($338,000) from exercise of stock options $6,775,000 $3,615,000 ses of common stock $765,00 $99,147,000) $798,000 for shares withheld for taxes $190,405,000) ($161,395,000) ($7 432,000) $12,572,000 ($6,148,000) 149,687,000 ($94,200,000) ($5,328,000) ($8,105,000) $107,239,000) ($3,691,000) ($5,674,000) ortease principal ($30 901 000) $20,058,000) ($603.000) ($445,000) ($550 000) ($523 000) ($115,000) nancing activities ($129.581.000' $192,114,000) y exchange rates on cash and cash e $5 458.000 ($2.512.000) 157,715,000 103,757,000) $36,811,000) $78,260.000) Net change in cash and cash equivalents 439,925,000 ($5.266 0001 $59,744,000 $3.263,000 Cash and cash equivalents at beginning of period $159,722,000 138,206,000 $45,808,000 $20,813,000 ($19,945,000) Cash and cash equivalents at end of period 225,143,000 $245,088,00 Cash and cash equivalents at beginning of period $649,436,000 $225,143,000 $315,862,000 $176,804,000 Cash and cash equivalents at end of period $589,692,000 $429,970,000 ($245,956,000) $1,089,361,000 $291,764,000 $110,247,000 $445,226,000 $176,804,000 $649,436,000 $245,956,000 $237,125,000 ($245,956,000) $263,606,000 $315,862,000 SUPPLEMENTAL CASH FLOW DISCLOSURE $589,692,000 $429,970,000 $291,764,000 Cash paid during the period Income taxes, net of refunds of $1,564, $5,389, and $3,824, as $104,068,000 $74,573,000 Income tax refunds $53,657,000 $14,407,000 $14,099,000 $29,916,000 53,504,000 Interest $2,931,000 $2,466,000 Operating leases 57,376,000 $3,811,00 $3,774,000 $501,000 $4,701,000 $61,120,000 $5,494,000 $4,640,000 Non-cash investing activities Accrued for purchases of property and equipment $2,721,000 Accrued for asset retirement obligations $1,171,000 $1,789,000 $2,020,000 $1,842,000 $1,101,000 $2,640,00 Accrued for shares withheld for taxes $224,000 $11,679,000 $4,706,000 $1,359,00 $3,419,000 $2,359,000 $1,394,000 $171,000 $786,000 $919,000 COMPREHENSIVE INCOME CASH FLOWS BALANCE SHEETS STOCKHOLDERS' EQUITY +Home Insert Draw Page Layout Formulas Data Review View Tell me Share Comments Calibri (Body) v 11 A A ab Wrap Text v Currency Insert v Ex Delete v Paste BIUV OvAv E Merge & Center v $ ~ % 9 Conditional Format Cell Sort & Find & Analyze Sensitivity Formatting as Table Styles Format v Filter Select Data B56 4 X V fx B C D E F G H Exported from Calcbench: Mon Jan 03 2022 14:27:53 GMT-0700 (Mountain Standard Time) 2 Deckers Outdoor Corp 3 CONSOLIDATED BALANCE SHEETS 4 Source Revised Y 2021 Y 2020 Y 2019 Y 2018 Y 2017 Y 2016 Y 2015 Y 2013 2012 2021-03-31 2020-03-31 2019-03-31 2018-03-31 2017-03-31 2016-03-31 2015-03-31 2013-12-31 2012-12-31 29 Goodwill and other intangible assets, net LIABILITIES AND STOCKHOLDERS' EQUITY 31 Short-term borrowing $638,000 $603,000 $578,000 $550,000 $67,475,000 $5,383,000 $9,728,000 32 Trade accounts payable $231,632,000 $147,892,000 $124,974,000 $93,939,00 $95,893,000 $100,593,000 85,714,000 $151,037,00 33 Accrued payroll $79,152,000 $42,309,00 $54,462,000 $55,695,000 $22,608,000 $20,625,000 $27,300,000 $35,725,000 34 Operating lease liabilities $46,768,000 $49,091,000 35 Other accrued expenses $68,995,000 $46,281,000 $47,963,000 $24,446,000 $31,815,000 $39,449,000 $41,066,000 $45,301,000 36 Income taxes payable $36,920,000 $11,104,000 $19,283,000 $11,006,000 $2,719,000 $6,461,000 $6,858,00 $49,453,000 7 Value added tax payable $4,901,000 $3,631,000 $3,239,000 $3,502,000 $5,466,000 $3,895,000 $1,221,000 $29,274,000 38 Total current liabilities $468,368,000 300,946,000 250,524,000 189,166,00 159,051,000 $238,498,000 $167,542,000 $320,518,000 39 Mortgage payable $30,263,000 $30,901,000 $31,504,000 $32,082,000 $32,631,000 $33,154,000 40 Long-term operating lease liabilities $176,274,000 $215,724,000 41 Income tax liability $60,094,000 $63,547,000 $60,616,000 $64,735,000 $13,216,00 $9,073,000 $5,087,000 42 Deferred rent obligations $21,107,00 $22,499,000 $18,433,00 $16,139,000 $15,663,000 $12,206,000 43 Other long-term liabilities $18,744,000 $14,518,000 $18,928,000 $15,696,00 $14,743,000 $14,256,000 $11,475,000 $38,886,000 44 Total long-term liabilities $255,112,000 $324,052,000 $131,552,000 $134,434,000 $78,474,000 $72,099,000 $65,379,000 $51,092,000 45 Stockholders' equity Common stock ($0.01 par value; 125,000 shares authorized; share $279,000 $280,000 $291,000 $304,000 $320,000 $320,000 $333,000 $346,000 47 Additional paid-in capital $203,310,000 $191,451,000 $178,227,000 $167,587,000 $160,797,000 $161,259,000 $158,777,00 $143,916,000 48 Retained earnings $1,257,379,000 $973,948,000 $889,266,000 $785,871,00 $819,589,000 $826,449,000 $798,370,00 $746,500,000 49 Accumulated other comprehensive loss ($16,743,000) ($25,559,000) ($22,654,000) ($12,983,000) ($26,451,000) $20,557,000) ($20,468,000) ($2,643,000) 50 Total stockholders equity $1,444,225,000 $1,140,120,000 $1,045,130,000 $940,779,000 $954,255,000 $967,471,000 $937,012,000 $888,119,000 51 undefined 52 Noncontrolling interest $723,480,000 53 Total equity $4 Total liabilities and stockholders' equity $2,167,705,000 $1,765,118,000 $1,427,206,000 $1,264,379,000 $1,191,780,000 $1,278,068,000 $1,169,933,000 $1,259,729,000 55 56 57 58 59 60 61 62 63 COMPREHENSIVE INCOME CASH FLOWS BALANCE SHEETS STOCKHOLDERS' EQUITY + " - + 90%A1 X V fx Exported from Calcbench: Mon Jan 03 2022 14:28:11 GMT-0700 (Mountain Standard Time) B C D E F G H 1 |Exported from Calcbench: Mon Jan 03 2022 14:28:11 GMT-0700 (Mountain Standard Time) Deckers Outdoor Corp CONSOLIDATED STATEMENTS OF STOCKHOLDERS' EQUITY Source Revised Y 2021 Y 2020 Y 2019 Y 2018 Y 2017 Y 2016 Y 2015 Y 2013 Y 2012 2021-03-31 2020-03-31 2019-03-31 2018-03-31 2017-03-31 2016-03-31 2015-03-31 2013-12-31 2012-12-31 8 Increase (Decrease) in Stockholders' Equity 9 Balance 10 Beginning balance (in shares) 27,999,000 29,141,000 30,447,000 31,987,000 32,020,000 33,292,000 34,624,000 34,618,000 Unrealized loss on short-term investments 12 Total comprehensive income 13 Contribution from noncontrolling interest 14 Stock compensation expense $13,136,000 15 Compensation expenses recorded $13,136,000 16 Beginning balance $1,140,120,000 $1,045,130,000 $940,779,000 $954,255,000 $967,471,000 $937,012,000 $888,849,000 17 Stock-based compensation expense (in shares) 4,000 10,000 10,000 15,000 23,000 16,000 11,000 15,000 18 Stock-based compensation expense $22,695,000 $14,471,000 $14,773,000 $14,302,000 $6,175,000 $6,622,000 $13,524,000 19 Shares issued upon vesting (in shares) 107,000 86,000 85,000 148,000 166,000 132,000 93,000 195,000 20 Shares issued upon vesting $1,502,000 $1,288,000 $1,025,000 $765,000 $798,000 1 Excess tax benefit from stock compensation $100,000 $471,000 $4,197,000 $319,000 22 Exercise of stock options (in shares) 107,000 58,000 8,000 23 Exercise of stock options $6,775,00 $3,615,000 $52,000 24 Cumulative adjustment from adoption of recent accounting pronouncements $468,000 $1,558,000 25 Shares withheld for taxes ($19,111,000 ($6,148,000) ($5,157,000) ($8,276,000) $7,533,000) ($4,610,000) ($5,674,000) ($8,635,000) 26 Repurchases of common stock (in shares) (307,000) (1,296,201) (1,400,699) (1,702,653) (222,471) (1,420,000 (1,436,000) 27 Repurchases of common stock ($99,147,000) ($190,405,000) ($161,395,000) ($149,687,000) ($12,572,000) ($94,200,000) $107,239,000) 28 Net income $382,575,000 $276,142,000 $264,308,000 $114,394,000 $5,710,000 $122,265,000 $161,780,000 $145,689,000 29 Foreign currency translation adjustment 30 Acquisition of noncontrolling interest 31 Total other comprehensive income (loss) $8,816,000 ($2,905,000) ($9,671,000) $13,468,000 ($5,894,000) ($89,000 $18,425,000) ($1,243,000) 32 Balance 33 Ending balance (in shares) 27,910,000 27,999,000 29,141,000 30,447,000 31,987,000 32,020,000 33,292,000 34,618,000 34 Ending balance $1,444,225,000 $1,140,120,000 $1,045,130,000 $940,779,000 $954,255,000 $967,471,000 $937,012,000 35 36 37 38 39 40 41 42 43 44 45 46 COMPREHENSIVE INCOME CASH FLOWS BALANCE SHEETS STOCKHOLDERS' EQUITY + + 90%
Step by Step Solution
There are 3 Steps involved in it
1 Expert Approved Answer
Step: 1 Unlock
Question Has Been Solved by an Expert!
Get step-by-step solutions from verified subject matter experts
Step: 2 Unlock
Step: 3 Unlock
Students Have Also Explored These Related Accounting Questions!