

Question: BA390 HW#2 Chapter 4. Forecasting Spring 2020_Type A 2. The data table below presents a popular brand of sweater sale (by quarters) over the past
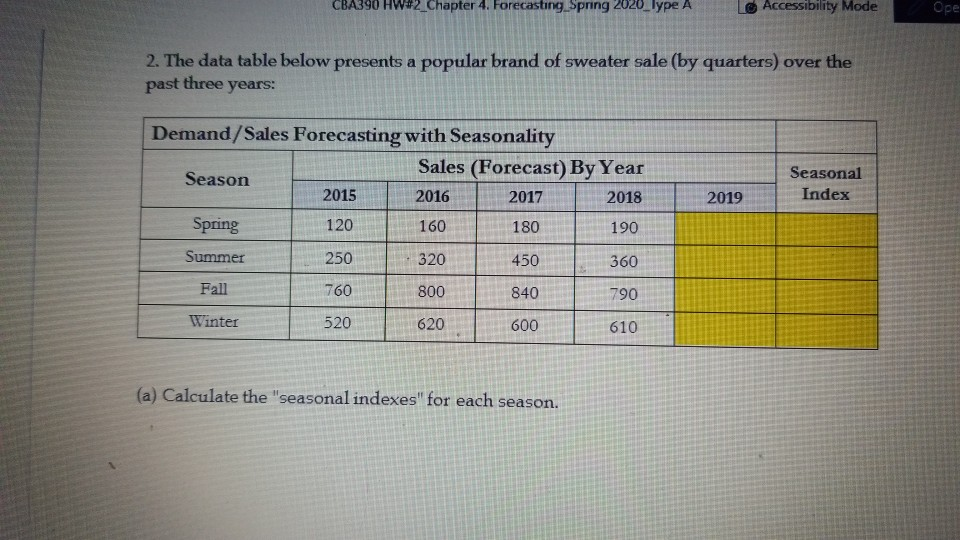
BA390 HW#2 Chapter 4. Forecasting Spring 2020_Type A 2. The data table below presents a popular brand of sweater sale (by quarters) over the past three years: Seasonal Index 2017 2019 Demand/Sales Forecasting with Seasonality Sales (Forecast) By Year Season 2016 2018 Spring 160 190 Summer 250 320 450 360 Fall 760 800 840 Winter 520 610 2015 120 180 790 620 600 (a) Calculate the "seasonal indexes" for each season. (b) Forecast the sale of each season in 2019, if we expect the annual sales for the product to be 2000 (Yearly Demand) units for the year 2019
Step by Step Solution
There are 3 Steps involved in it
1 Expert Approved Answer
Step: 1 Unlock

Question Has Been Solved by an Expert!
Get step-by-step solutions from verified subject matter experts
Step: 2 Unlock
Step: 3 Unlock