

Question: < Back Excel assign 2.docx The ages of a sample of 100 executives are listed. 30 50 60 49 61 62 54 42 47
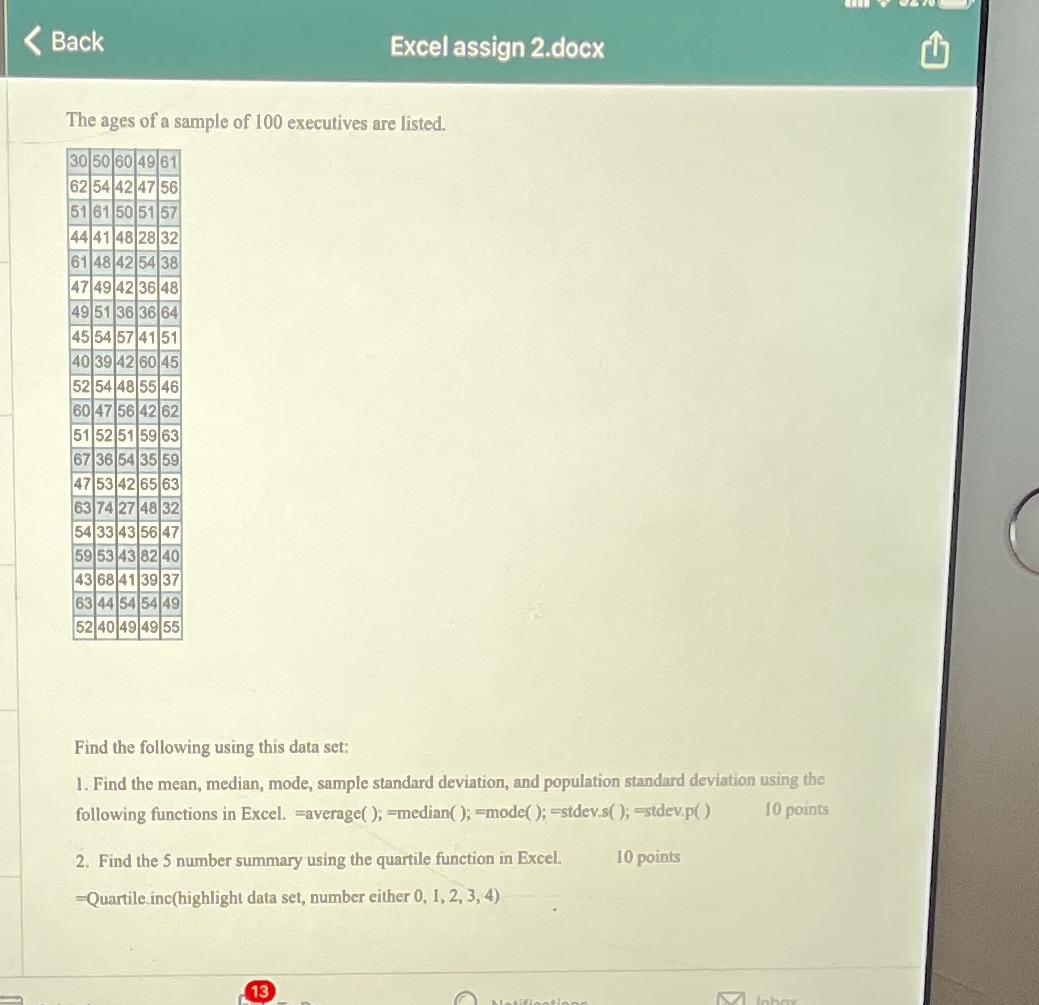
< Back Excel assign 2.docx The ages of a sample of 100 executives are listed. 30 50 60 49 61 62 54 42 47 56 51 61 50 51 57 44 41 48 28 32 61 48 42 54 38 47 49 42 36 48 49 51 36 36 64 45 54 57 41 51 40 39 42 60 45 52 54 48 55 46 60 47 56 42 62 51 52 51 59 63 67 36 54 35 59 47 53 42 65 63 63 74 27 48 32 54 33 43 56 47 59 53 43 82 40 43 68 41 39 37 63 44 54 54 49 52 40 49 49 55 Find the following using this data set: 1. Find the mean, median, mode, sample standard deviation, and population standard deviation using the following functions in Excel. average(); -median(); -mode(); stdev.s(); =stdev.p() 2. Find the 5 number summary using the quartile function in Excel. -Quartile.inc(highlight data set, number either 0, 1, 2, 3, 4) 10 points 10 points 13
Step by Step Solution
There are 3 Steps involved in it

Get step-by-step solutions from verified subject matter experts