

Question: Back to Assignment Attempts Average / 3 3 . Profit maximization using total cost and total revenue curves Suppose Musashi runs a small business that
Back to Assignment
Attempts Average
Profit maximization using total cost and total revenue curves
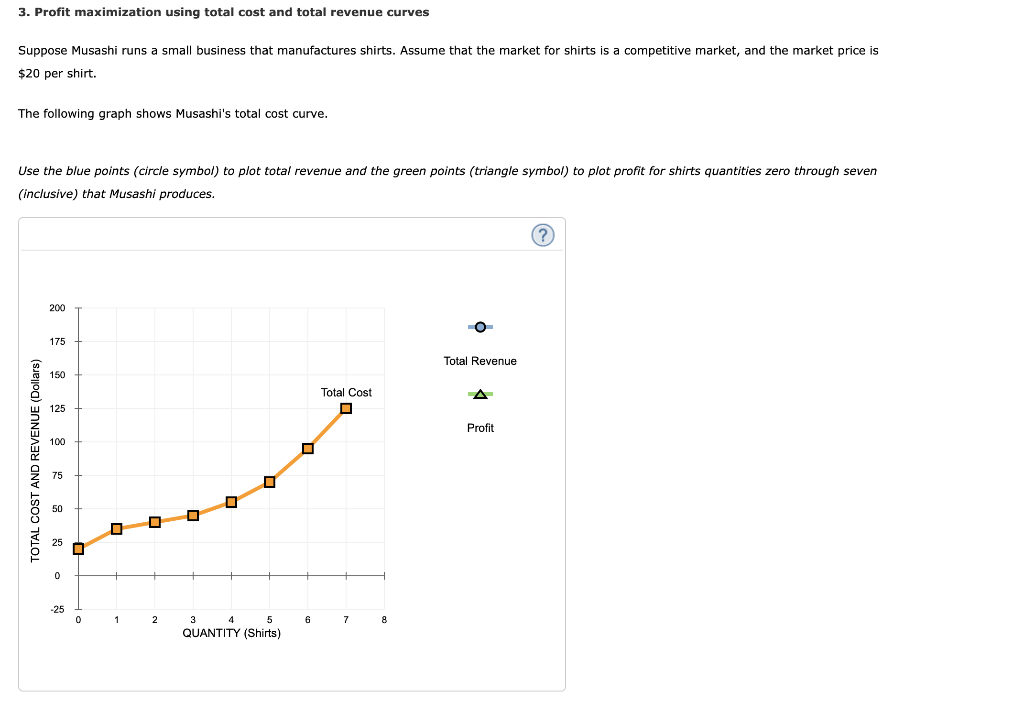
Suppose Musashi runs a small business that manufactures shirts. Assume that the market for shirts is a perfectly competitive market, and the market price is $ per shirt.
The following graph shows Musashi's total cost curve.
Use the blue points circle symbol to plot total revenue and the green points triangle symbol to plot profit for the first seven shirts that Musashi produces, including zero shirts. Calculate Musashi's marginal revenue and marginal cost for the first seven shirts he produces and plot them on the following graph. Use the blue points circle symbol to plot marginal revenue and the orange points square symbol to plot marginal cost.
Note: Be sure to plot marginal values between the appropriate whole unit values. For instance, plot values at and so on
Musashi's profit is maximized when he produces
shirts. When he does this, the marginal cost of the last shirt he produces is
which
is
qquad than the price Musashi receives for each shirt he sells. The marginal cost of producing an additional shirt that is one more shirt than would maximize his profit is which is than the price Musashi receives for each shirt he sells. Therefore, Musashi's profit
maximizing quantity corresponds to the intersection of t th
curves. Because Musashi is a price taker, this
last condition can also be written as
Step by Step Solution
There are 3 Steps involved in it
1 Expert Approved Answer
Step: 1 Unlock

Question Has Been Solved by an Expert!
Get step-by-step solutions from verified subject matter experts
Step: 2 Unlock
Step: 3 Unlock