

Question: Back to Assignment Attempts Keep the Highest / 3 4. Analyzing the effects of a trade deficit You have just been hired by the U.S.
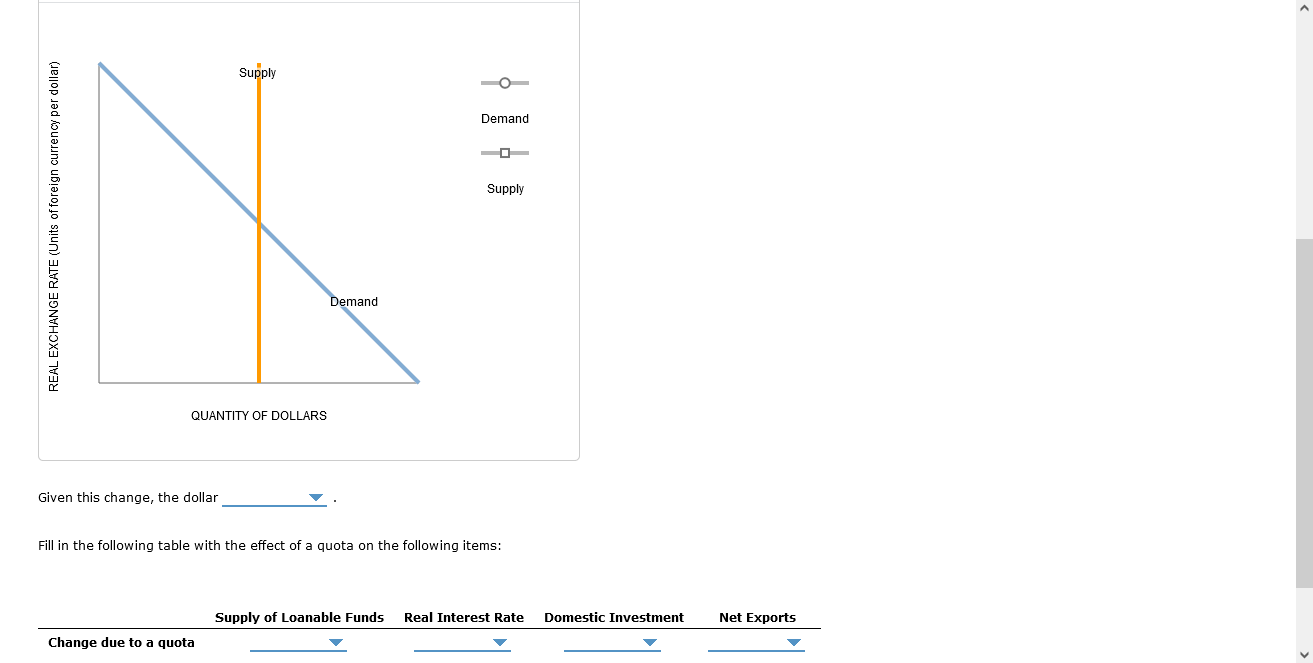
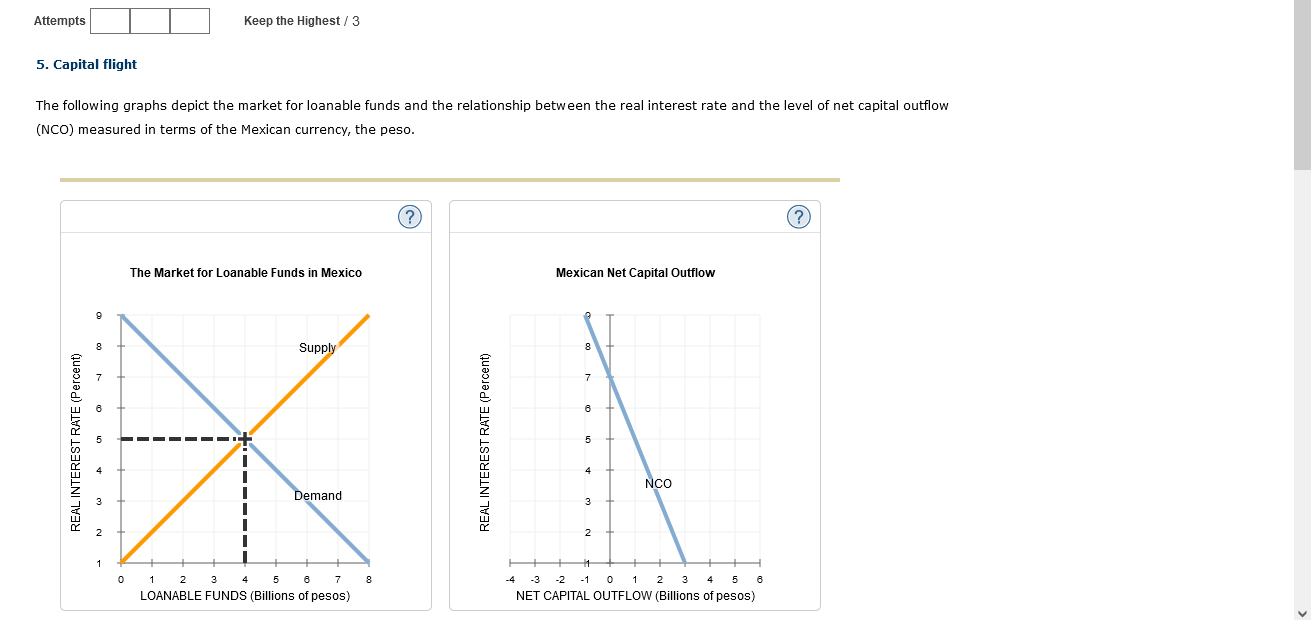
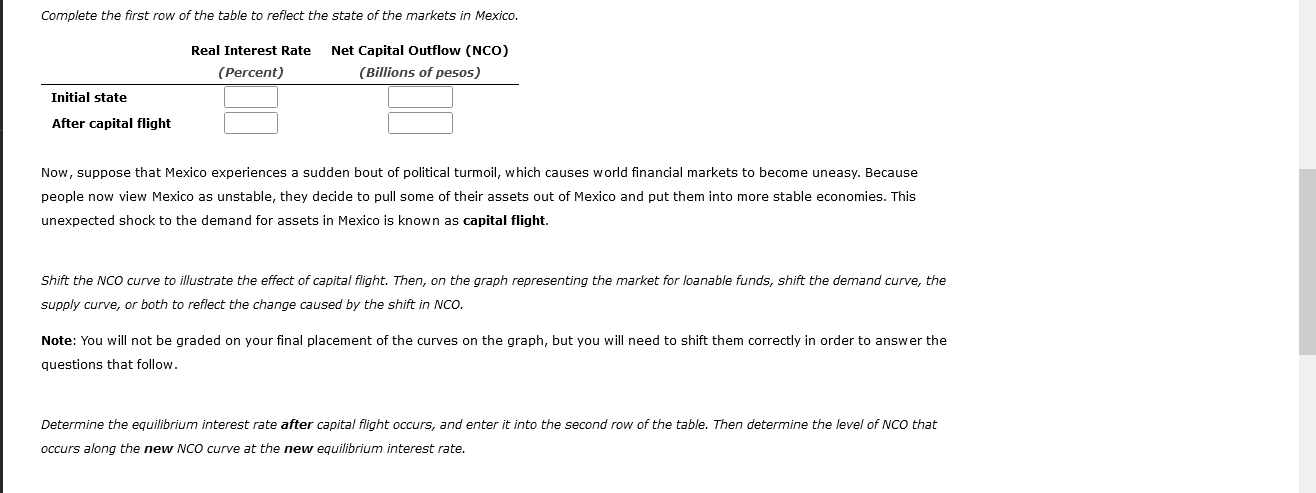
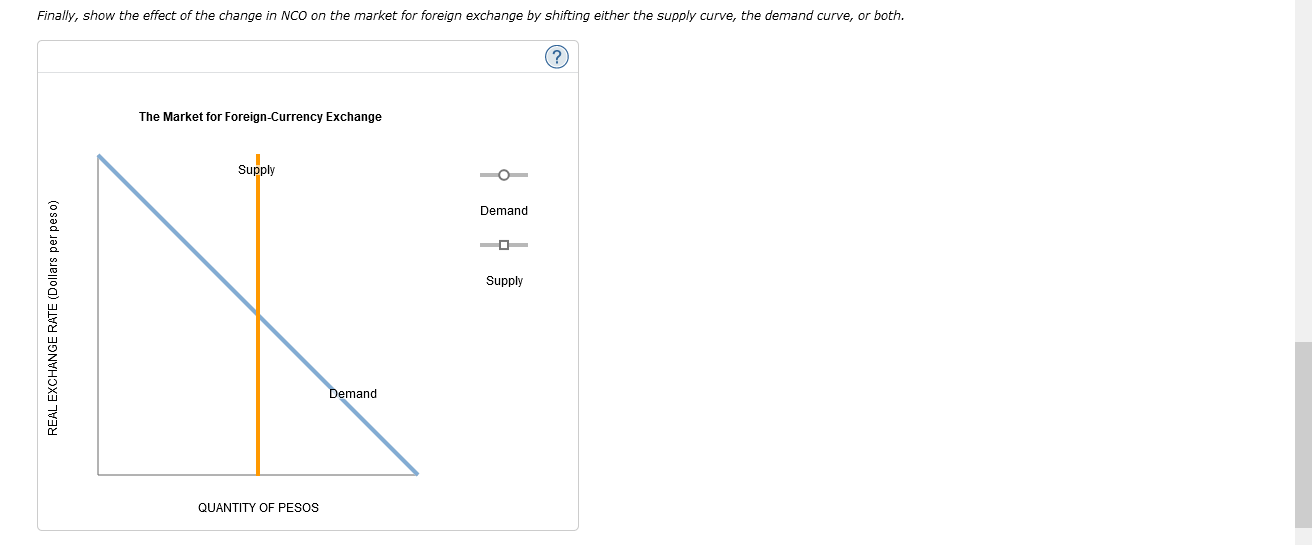
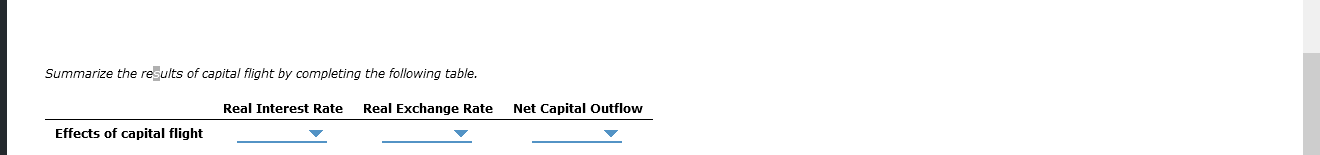
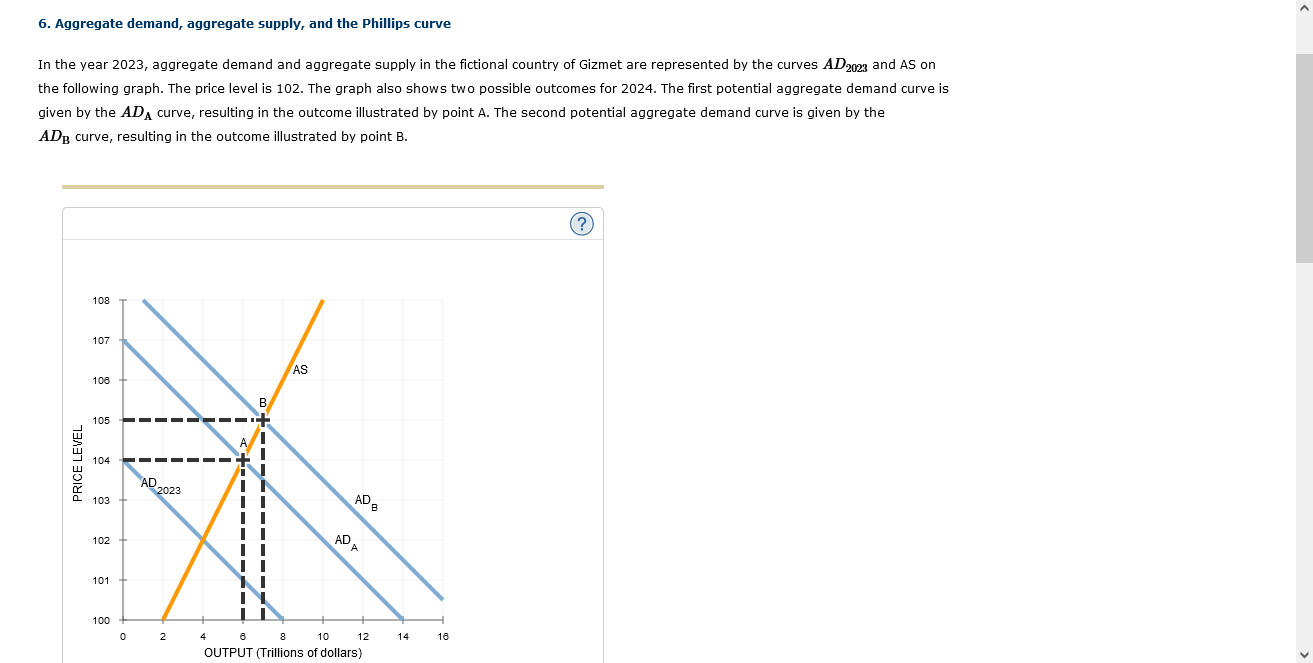
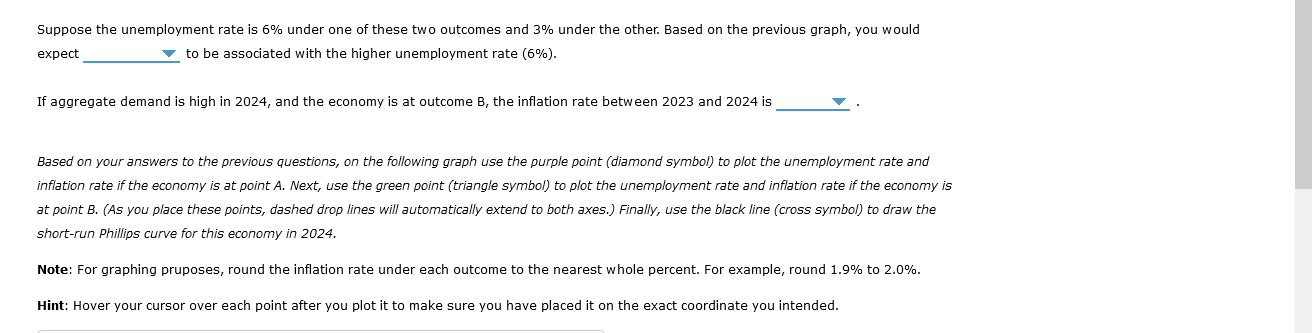
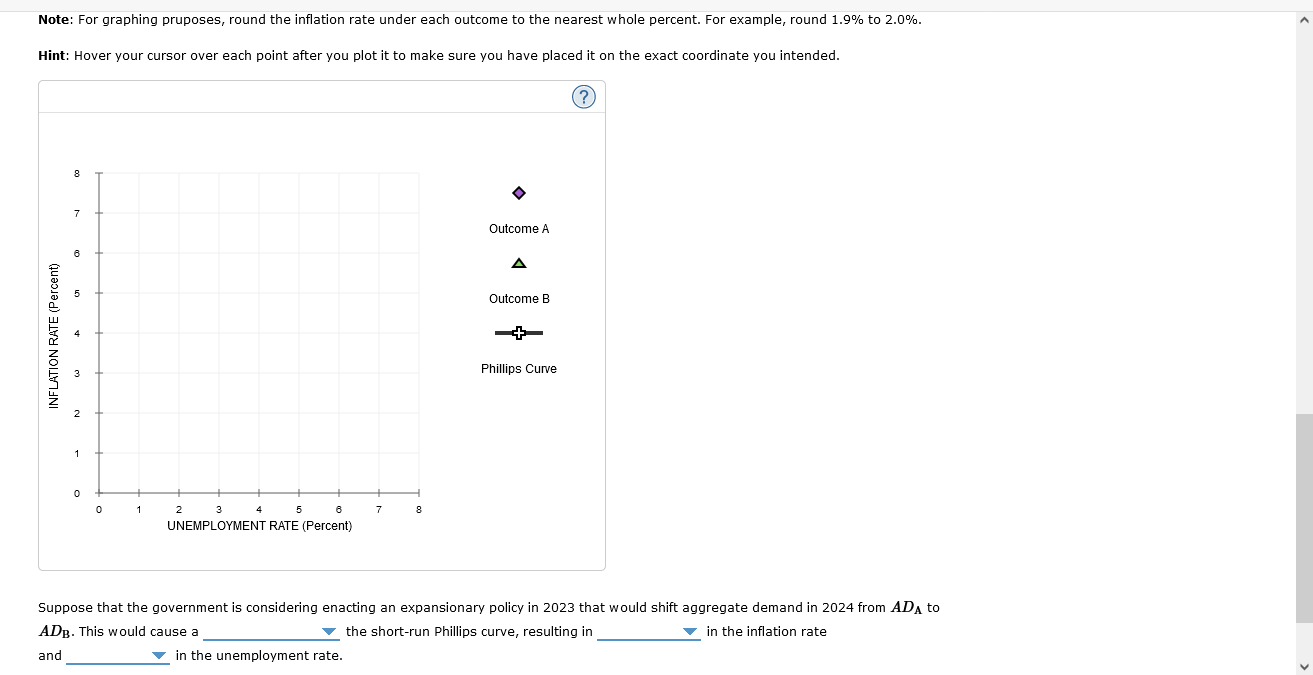
Back to Assignment Attempts Keep the Highest / 3 4. Analyzing the effects of a trade deficit You have just been hired by the U.S. government to analyze the following scenario. Suppose the U.S. agricultural industry is concerned about the level of fruit and vegetable imports to the United States, a practice that hurts domestic producers. Lobbyists claim that implementing a quota on imports would shrink the size of the trade deficit. The following exercise will help you to analyze this claim. The following graph shows the demand and supply of U.S. dollars in a model of the foreign-currency exchange market. Shift the demand curve, the supply curve, or both to show what would happen if the government decided to implement the quota.Supply O Demand Supply REAL EXCHANGE RATE (Units of foreign currency per dollar) Demand QUANTITY OF DOLLARS Given this change, the dollar Fill in the following table with the effect of a quota on the following items: Supply of Loanable Funds Real Interest Rate Domestic Investment Net Exports Change due to a quotaAttempts Keep the Highest / 3 5. Capital flight The following graphs depict the market for loanable funds and the relationship between the real interest rate and the level of net capital outflow (NCO) measured in terms of the Mexican currency, the peso. (?) The Market for Loanable Funds in Mexico Mexican Net Capital Outflow Supply Co REAL INTEREST RATE (Percent) REAL INTEREST RATE (Percent) A NCO Demand N 2 2 3 5 7 8 -4 -3 -2 2 -1 0 1 2 3 5 LOANABLE FUNDS (Billions of pesos) NET CAPITAL OUTFLOW (Billions of pesos)Complete the first row of the table to reflect the state of the markets in Mexico. Real Interest Rate Net Capital Outflow (NCO) (Percent) ( Billions of pesos) Initial state After capital flight Now, suppose that Mexico experiences a sudden bout of political turmoil, which causes world financial markets to become uneasy. Because people now view Mexico as unstable, they decide to pull some of their assets out of Mexico and put them into more stable economies. This unexpected shock to the demand for assets in Mexico is known as capital flight. Shift the NCO curve to illustrate the effect of capital flight. Then, on the graph representing the market for loanable funds, shift the demand curve, the supply curve, or both to reflect the change caused by the shift in NCO. Note: You will not be graded on your final placement of the curves on the graph, but you will need to shift them correctly in order to answer the questions that follow. Determine the equilibrium interest rate after capital flight occurs, and enter it into the second row of the table. Then determine the level of NCO that occurs along the new NCO curve at the new equilibrium interest rate.Finally, show the effect of the change in NCO on the market for foreign exchange by shifting either the supply curve, the demand curve, or both. The Market for Foreign-Currency Exchange Supply O Demand Supply REAL EXCHANGE RATE (Dollars per peso) Demand QUANTITY OF PESOSSummarize the results of capital flight by completing the following table. Real Interest Rate Real Exchange Rate Net Capital Outflow Effects of capital flight6. Aggregate demand, aggregate supply, and the Phillips curve In the year 2023, aggregate demand and aggregate supply in the fictional country of Gizmet are represented by the curves AD2023 and AS on the following graph. The price level is 102. The graph also shows two possible outcomes for 2024. The first potential aggregate demand curve is given by the ADA curve, resulting in the outcome illustrated by point A. The second potential aggregate demand curve is given by the ADB curve, resulting in the outcome illustrated by point B. 108 107 AS 108 105 A 104 PRICE LEVEL AL 2023 ADB 103 102 ADA 101 100 2 10 12 14 16 0 8 OUTPUT (Trillions of dollars)Suppose the unemployment rate is 6% under one of these two outcomes and 3% under the other. Based on the previous graph, you would expect to be associated with the higher unemployment rate (6%). If aggregate demand is high in 2024, and the economy is at outcome B, the inflation rate between 2023 and 2024 is Based on your answers to the previous questions, on the following graph use the purple point (diamond symbol) to plot the unemployment rate and inflation rate if the economy is at point A. Next, use the green point (triangle symbol) to plot the unemployment rate and inflation rate if the economy is at point B. (As you place these points, dashed drop lines will automatically extend to both axes.) Finally, use the black line (cross symbol) to draw the short-run Phillips curve for this economy in 2024. Note: For graphing pruposes, round the inflation rate under each outcome to the nearest whole percent. For example, round 1.9% to 2.0%. Hint: Hover your cursor over each point after you plot it to make sure you have placed it on the exact coordinate you intended.Note: For graphing pruposes, round the inflation rate under each outcome to the nearest whole percent. For example, round 1.9% to 2.0%. Hint: Hover your cursor over each point after you plot it to make sure you have placed it on the exact coordinate you intended. CO Outcome A 4 5 Outcome B + INFLATION RATE (Percent) 3 Phillips Curve 2 0 2 3 4 5 7 UNEMPLOYMENT RATE (Percent) Suppose that the government is considering enacting an expansionary policy in 2023 that would shift aggregate demand in 2024 from ADA to ADB. This would cause a the short-run Phillips curve, resulting in in the inflation rate and in the unemployment rate
Step by Step Solution
There are 3 Steps involved in it

Get step-by-step solutions from verified subject matter experts