

Question: Back to Assignment Attempts Keep the Highest l 2 4 . Total economic surplus The following graph plots the supplyr and demand curves in the
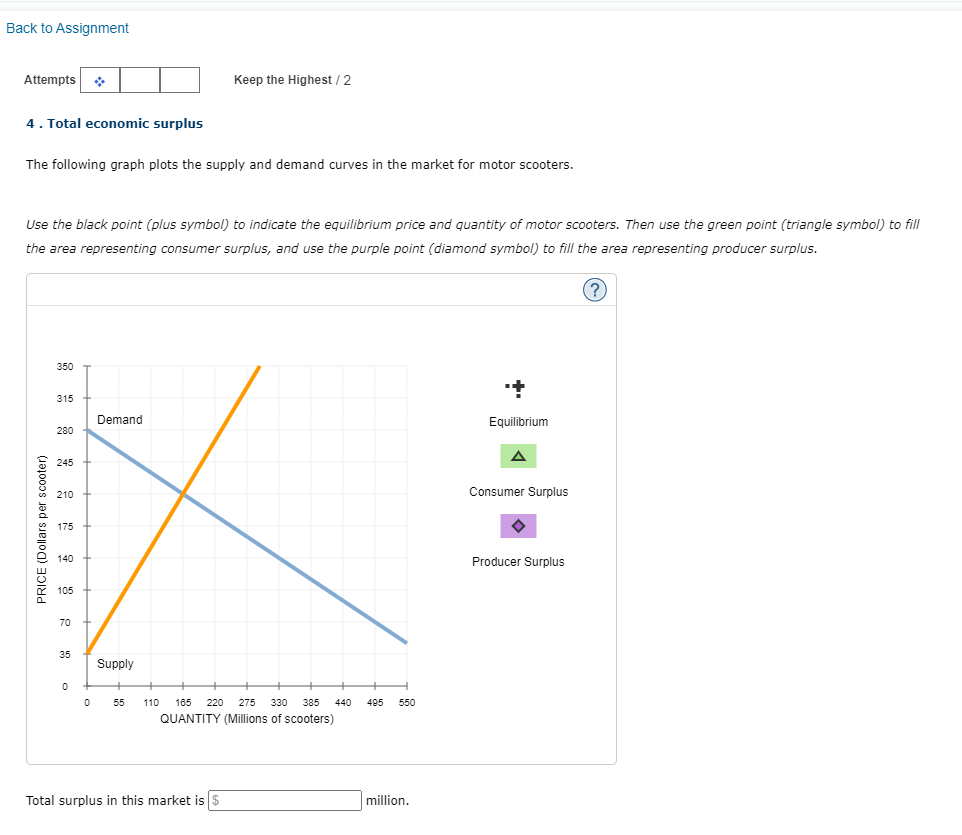
Back to Assignment Attempts Keep the Highest l 2 4 . Total economic surplus The following graph plots the supplyr and demand curves in the market for motor scooters. Use the black point (plus symbol) to indicate the equilibrium price and quantity of motor scooters, Then use the green point ( triangle symbol) to i'ilir the area representing consumer surplus, and use the purple point (diamond symbol) to ll the area representing producer surplus. 350 --I- 315 - Demand Equilibrium 230 245 A 210 Consumer Surplus I Producer Surplus 3\" PRICE (Dollars per scooter) s' 70 o 55 110 165 220 2r5 330 335 440 495 550 QUANTITY {Millions of scooters] Total surplus in this market is million
Step by Step Solution
There are 3 Steps involved in it

Get step-by-step solutions from verified subject matter experts