

Question: Backgroud: DATA TABLE Part I Pure Tone Tuning fork 1 Tuning fork 2 Frequency stamped on tuning fork (Hz) 256 5/ 2 Period from waveform
Backgroud:
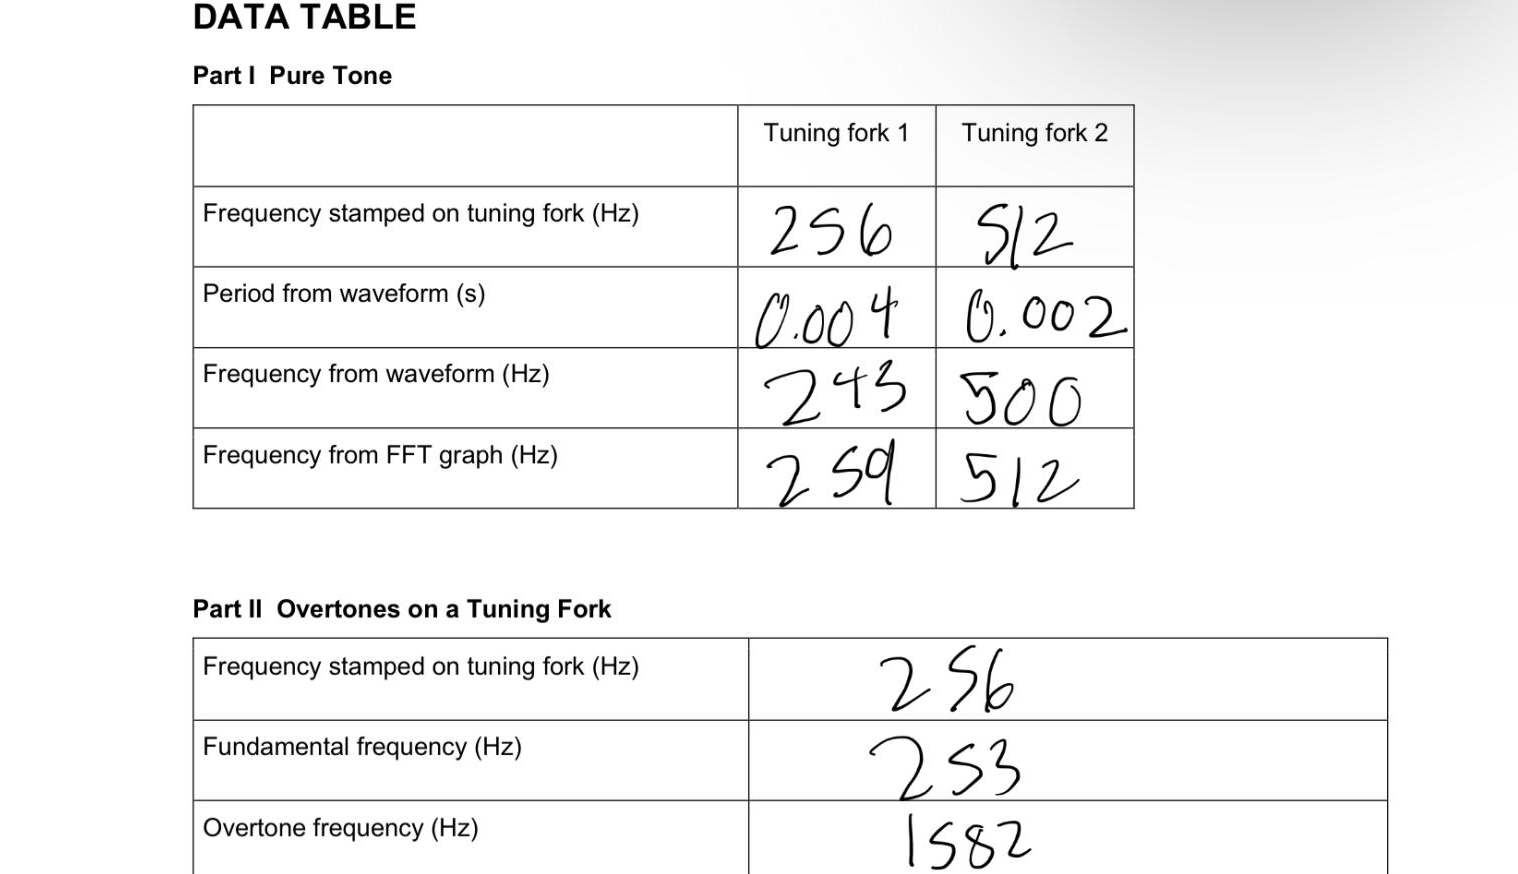
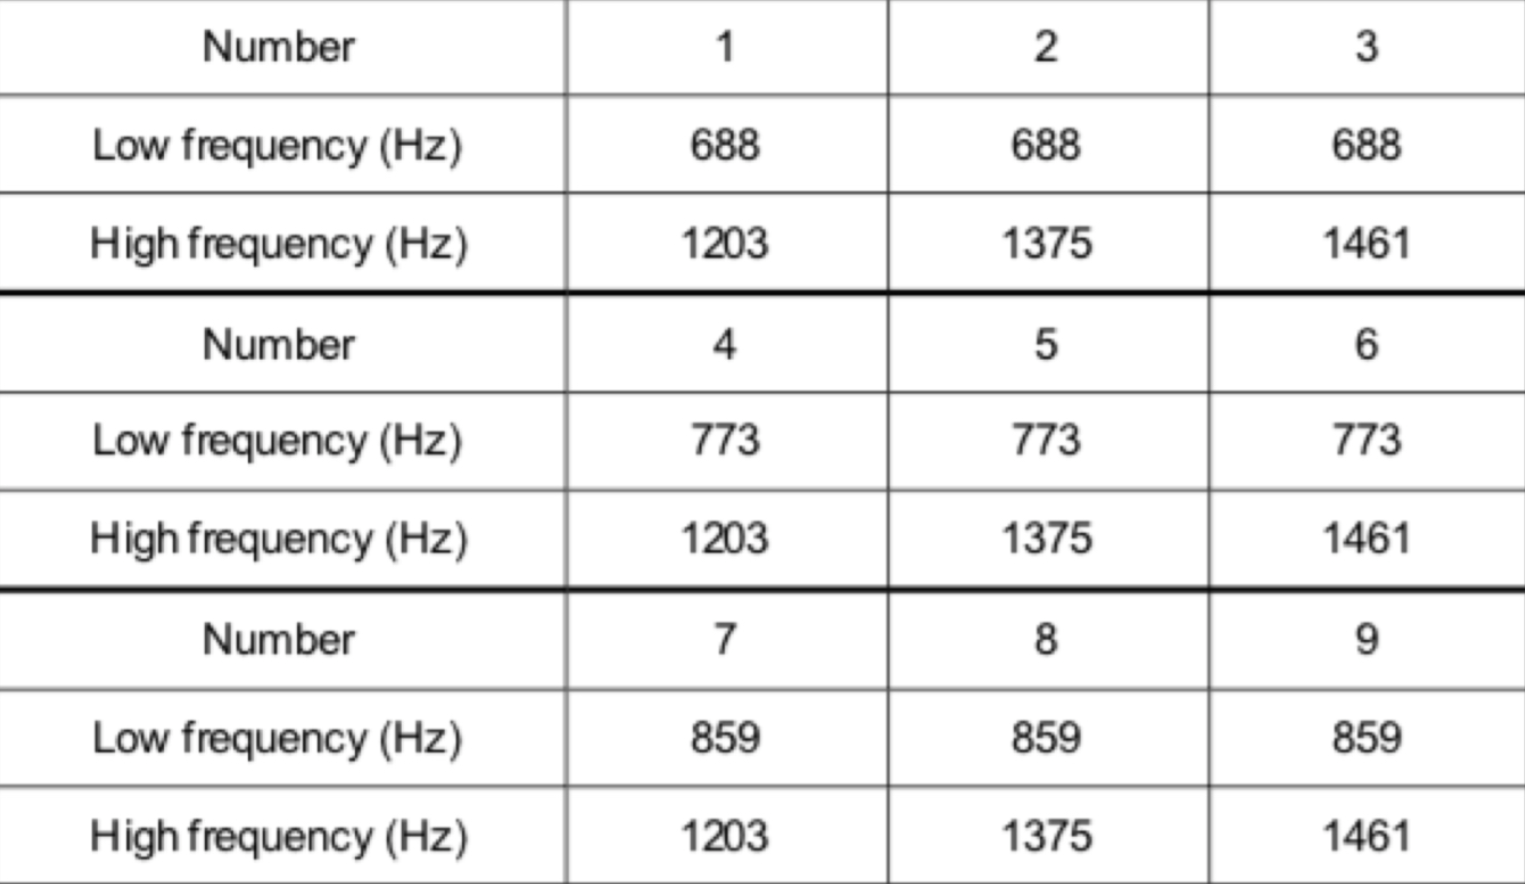
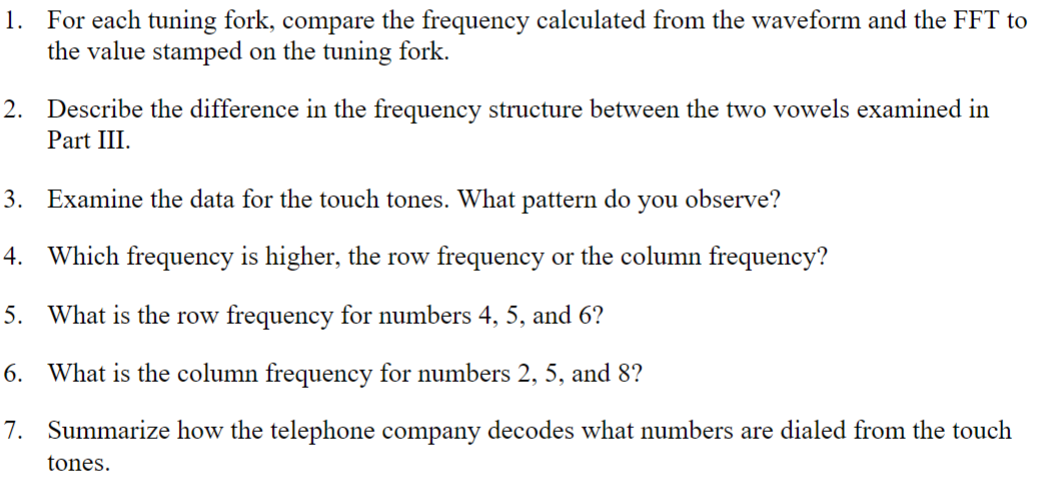
DATA TABLE Part I Pure Tone Tuning fork 1 Tuning fork 2 Frequency stamped on tuning fork (Hz) 256 5/ 2 Period from waveform (s) C.00 4 0. 002 Frequency from waveform (Hz) 245 500 Frequency from FFT graph (Hz) 2 59 1512 Part II Overtones on a Tuning Fork Frequency stamped on tuning fork (Hz) 2 56 Fundamental frequency (Hz) 253 Overtone frequency (Hz) 1582\fFor each tuning fork, compare the frequency calculated from the waveform and the FFT to the value stamped on the tuning fork. Describe the difference in the frequency structure between the two vowels examined in Part III. Examine the data for the touch tones. What pattern do you observe? Which frequency is hi gher, the row frequency or the column frequency? What is the row frequency for numbers 4. 5. and 6? What is the column frequency for numbers 2' 5. and 8? Summarize how the telephone company decodes what numbers are dialed from the touch tones
Step by Step Solution
There are 3 Steps involved in it

Get step-by-step solutions from verified subject matter experts