

Question: Background: Based on their quality control work so far, the VivosysQ project team believes that they can significantly increase customer satisfaction by reducing hold times
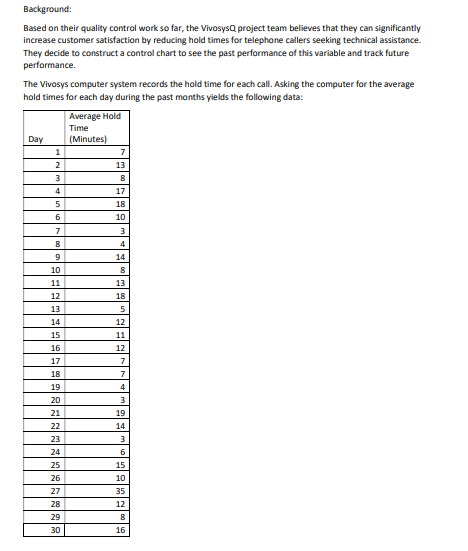
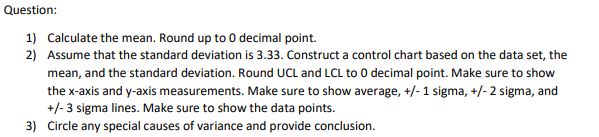
Background: Based on their quality control work so far, the VivosysQ project team believes that they can significantly increase customer satisfaction by reducing hold times for telephone callers seeking technical assistance. They decide to construct a control chart to see the past performance of this variable and track future performance. The Vivosys computer system records the hold time for each call. Asking the computer for the average t the past months yields the following data: Question: 1) Calculate the mean. Round up to 0 decimal point. 2) Assume that the standard deviation is 3.33. Construct a control chart based on the data set, the mean, and the standard deviation. Round UCL and LCL to 0 decimal point. Make sure to show the x-axis and y-axis measurements. Make sure to show average, +/1 sigma, +/2 sigma, and +/3 sigma lines. Make sure to show the data points. 3) Circle any special causes of variance and provide conclusion
Step by Step Solution
There are 3 Steps involved in it

Get step-by-step solutions from verified subject matter experts