

Question: Background- Data Analysis CIS 210 is taken by nearly all CIS majors, but also by many students majoring in other fields, and by students who
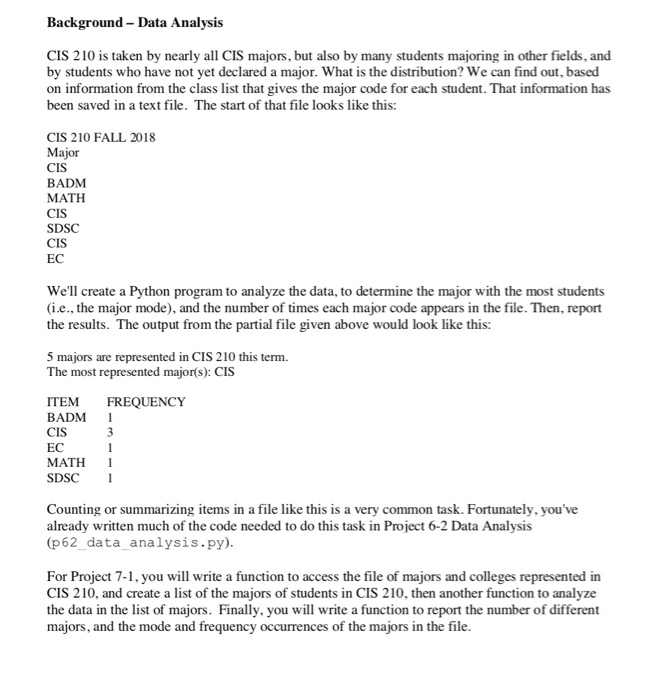
Background- Data Analysis CIS 210 is taken by nearly all CIS majors, but also by many students majoring in other fields, and by students who have not yet declared a major. What is the distribution? We can find out, based on information from the class list that gives the major code for each student. That information has been saved in a text file. The start of that file looks like this: CIS 210 FALL 2018 Major CIS BADM MATH CIS SDSC CIS EC We'll create a Python program to analyze the data, to determine the major with the most students (i.e., the major mode), and the number of times each major code appears in the file. Then, report the results. The output from the partial file given above would look like this: 5 majors are represented in CIS 210 this term. The most represented major(s): CIS ITEM FREQUENCY BADM CIS EC MATH SDSC 1 Counting or summarizing items in a file like this is a very common task. Fortunately, you've already written much of the code needed to do this task in Project 6-2 Data Analysis (p62_data analysis.py) For Project 7-1, you will write a function to access the file of majors and colleges represented in CIS 210. and create a list of the majors of students in CIS 210, then another function to analyze the data in the list of majors. Finally, you will write a function to report the number of different majors, and the mode and frequency occurrences of the majors in the file
Step by Step Solution
There are 3 Steps involved in it

Get step-by-step solutions from verified subject matter experts